BPF Memory Forensics with Volatility 3
Introduction and Motivation
Have you ever wondered how an eBPF rootkit looks like? Well, here’s one, have a good look:
Upon receiving a command and control (C2) request, this specimen can execute arbitrary commands on the infected machine, exfiltrate sensitive files, perform passive and active network discovery scans (like nmap), or provide a privilege escalation backdoor to a local shell. Of course, it’s also trying its best to hide itself from system administrators hunting it with different command line tools such as ps, lsof, tcpdump an others or even try tools like rkhunter or chkrootkit.
Well, you say, rootkits have been doing that for more than 20 years now, so what’s the news here? The news aren’t that much the features, but rather how they are implemented. Everything is realized using a relatively new and rapidly evolving kernel feature: eBPF. Even though it has been in the kernel for almost 10 years now, we’re regularly surprised by how many experienced Linux professionals are still unaware of its existence, not even to mention its potential for abuse.
The above picture was generated from the memory image of a system infected with ebpfkit
, an open-source PoC rootkit from 2021, using a plugin for the Volatility 3
memory forensics framework. In this blog post, we will present a total of seven plugins that, taken together, facilitate an in depth analysis of the state of the BPF subsystem.
We structured this post as follows: The next section provides an introduction to the BPF subsystem, while the third section highlights its potential for (ab)use by malware. In section four, we will introduce seven Volatility 3 plugins that facilitate the examination of BPF malware. Section five presents a case study, followed by a section describing our testing and evaluation of the plugins on various Linux distributions. In the last section, we conclude with a discussion of the steps that are necessary to integrate our work into the upstream Volatility project, other challenges we encountered, and open research questions.
Note: The words “eBPF” and “BPF” will be used interchangeably throughout this post.
The BPF Subsystem
Before delving into the complexities of memory forensics, it is necessary to establish some basics about the BPF subsystem. Readers that are already familiar with the topic can safely skip this section.
To us, BPF is first of all an instruction set architecture (ISA). It has ten general purpose registers, which are 64 bit wide, and there are all of the basic operations that you would expect a modern ISA to have. Its creator, Alexei Starovoitov, once described it as a kind of simplified x86-64 and would probably never have imagined that the ISA he cooked up back in 2014 would once enter a standardization process at the IETF. The interested reader can find the current proposed standard here . Of course, there are all the other things that you would expect to come with an ISA, like an ABI that defines the calling convention, and a binary encoding that maps instructions to sequences of four or eight bytes.
The BPF ISA is used as a compilation target (currently by clang - gcc support is on the way) for programs written in high-level languages (currently C and Rust), however, it is not meant to be implemented in hardware. Therefore, it is conceptually more similar to WebAssembly or Java Bytecode than x86-64 or arm64, i.e., BPF programs are meant to be executed by a runtime that implements the BPF virtual machine (VM). Several BPF runtimes exist, but the “reference implementation” is in the Linux kernel.
Runtimes are, of course, free to choose how they implement the BPF VM. The instruction set was defined in a way that makes it easy to implement a one-to-one just in time (JIT) compiler for many CPU architectures. In fact, in the Linux kernel, even non-mainstream architectures like powerpc, sparc or s390 have BPF JITs. However, the kernel also has an interpreter to run BPF programs on architectures that do not yet support JIT compilation.
Aside: The BPF platform is what some call a “verified target”. This means that in order for a program to be valid it has to have some “non-local” properties. Those include the absence of (unbounded) loops, registers and memory can only be read after they have been written to, the stack depth may not exceed a hard limit, and many more. The interested reader can find a more exhaustive description here . In practice, runtime implementations include an up-front static verification stage and refuse to execute programs that cannot be proven to meet these requirements (some runtime checks may be inserted to account for the known shortcomings of static analysis). This static verification approach is at the hearth of BPF’s sandboxing model for untrusted code.
Roughly speaking, the BPF subsystem includes, besides the implementation of the BPF VM, a user and kernel space interface for managing the program life cycle as well as infrastructure for transitioning the kernel control flow in and out of programs running inside the VM. Other subsystems can be made “programmable” by integrating the BPF VM in places where they want to allow the calling of user-defined functions, e.g., for decision making based on their return value. The networking subsystem, for example, supports handing all incoming and outgoing packets on an interface to a BPF program. Those programs can freely rewrite the packet buffer or even decide to drop the packet all together. Another example is the tracing subsystem that supports transitioning control into BPF programs at essentially any instruction via one of the various ways it has to hook into the kernel and user space execution. The final example here is the Linux Security Module (LSM) subsystem that supports calling out to BPF programs at any of its security hooks placed at handpicked choke points in the kernel. There are many more examples of BPF usage in the kernel and even more in academic research papers and patches on the mailing list, but we guess we conveyed the general idea.
BPF programs can interact with the world outside of the VM via so called helpers or kfuncs, i.e., native kernel functions that can be called by BPF programs. Services provided by these functions range from getting a timestamp to sending a signal to the current task or reading arbitrary memory. Which functions a program can call depends on the program type that was selected when loading it into the VM. When reversing BPF programs, looking for calls to interesting kernel functions is a good point to start.
The second ingredient you need in order to get any real work done with a BPF program are maps. While programs can store data during their execution using stack memory or by allocating objects on the heap, the only way to persist data across executions of the same program are maps. Maps are mutable persistent key value stores that can be accessed by BPF programs and user space alike, as such they can be used for user-to-BPF, BPF-to-user, or BPF-to-BPF communication, where in the last case the communicating programs may be different or the same program at different times.
Another relevant aspect of the BPF ecosystem is the promise of compile once run everywhere (CORE), i.e., a (compiled) BPF program can be run inside of a wide range of Linux kernels that might have different configurations, versions, compilers, and even CPU architectures. This is achieved by having the compiler emit special relocation entries that are processed by a user-space loader prior to loading a program into the kernel’s BPF VM. The key ingredient that enables this approach is a self-description of the running kernel in the form of BPF Type Format (BTF) information, which is made available in special files under /sys/kernel/btf/. For example, BPF source code might do something like current->comm to access the name of the process in whose context the program is running. This might generate an assembly instruction that adds the offset of the comm field to a pointer to the task descriptor that is stored in a register, i.e., ADD R5, IMM. However, the immediate offset might vary due to kernel version, configuration, structure layout randomization or CPU architecture. Thus, the compiler would emit a relocation entry that tells the user-space loader running on the target system to check the kernel’s BTF information in order to overwrite the placeholder with the correct offset. Together with other kinds of relocations, which address things like existence of types and enum variants or their sizes, the loader be used to run the same BPF program on a considerable number of kernels.
Aside: A problem with the CORE implementation described above is that signatures over BPF programs are meaningless as the program text will be altered by relocations before loading. To allow for a meaningful ahead of time signature there is another approach in which a loader program is generated for the actual program. The loader program is portable without relocations and is signed and loaded together with the un-relocated bytecode of the actual program. Thus, the problem is solved as all text relocations happen in the kernel, i.e., after signatures have been verified.
However, there are of course limits to the portability of BPF programs. As we all know, the kernel takes great care to never break user space, within kernel land, on the other hand, there are no stability guarantees at all. BPF programs are not considered to be part of user space and thus there are no forward or backward compatibility guarantees. In practice, that means that APIs exposed to BPF could be removed or changed, attachment points could vanish or change their signature, or programs that are currently accepted by the static verifier could be rejected in the future. Furthermore, changes in kernel configuration could remove structure fields, functions, or kernel APIs that programs rely on. In that sense, BPF programs are in a position similar to out-of-tree kernel modules. That being said, due to CORE, there is no need to have the headers of the target kernel available at compile time and thus a lot less knowledge about the target is needed to be confident that the program will be able to run successfully. Furthermore, in the worst case the program will be rejected by the kernel, but there are no negative implications on system stability by attempting to load it.
Finally, we should mention that BPF is an entirely privileged interface. There are multiple BPF-related capabilities that a process can have, which open up various parts of the subsystem. This has not always been the case. A few years ago, unprivileged users were able to load certain types of BPF programs, however, access to the BPF VM comes with two potential security problems. First, the security entirely relies on the correctness of the static verification stage, which is notoriously complex and must keep up with the ever-expanding feature set. It has been demonstrated that errors in the verification process can be exploited for local privilege escalation, e.g., CVE-2020-8835 or CVE-2021-3490 . Second, even within the boundaries set by the verifier, the far-reaching control over the CPU instructions that get executed in kernel mode opens up the door for Spectre attacks, c.f., Jann Horn’s writeup or the original Spectre paper . For those reasons, the kernel community has decided to remove unprivileged access to BPF by default .
BPF Malware
To better understand the implications the addition of the BPF VM has for the Linux malware landscape, we would like to start with a quote from “BPF inventor” Alexei Starovoitov: “If in the past the whole kernel would maybe be [a] hundred of programmers across the world, now a hundred thousand people around the world can program the kernel thanks to BPF.”, i.e., BPF significantly lowers the entry barrier to kernel programming and shipping applications that include kernel-level code. While the majority of new kernel programmers are well-intentioned and aim to develop innovative and useful applications, experience has shown that there will be some actors who seek to use new kernel features for malicious purposes.
From a malware author’s perspective, one of the first questions is probably how likely it is that a target system will support the loading of malicious BPF programs. According to our personal experience it is safe to say that most general-purpose desktop and server distributions enable BPF. The feature is also enabled in the android-base.config as BPF plays a significant role in the Android OS, i.e., essentially every Android device should support BPF - from your fridge to your phone. Concerning the custom kernels used by big tech companies let me quote Brendan Gregg, another early BPF advocate: “As companies use more and more eBPF also, it becomes harder for your operating system to not have eBPF because you are no longer eligible to run workloads at Netflix or at Meta or at other companies.”. What is more, Google relies on BPF (through cilium
) in its Kubernetes engine and Facebook uses it for its layer 4 load balancer katran
. For a more comprehensive survey of BPF usage in cloud environments we recommend section 5 of Cross Container Attacks: The Bewildered eBPF on Clouds
by Yi He et al. Thus, most of the machines that constitute “the cloud” are likely to support BPF. This is particularly interesting as signature verification for BPF programs is still not available, making it the only way to run kernel code on locked-down systems that restrict the use of kernel modules.
However, enabling the BPF subsystem, i.e., CONFIG_BPF, is only the beginning of the story. There are many compile-time or run-time configuration choices that affect the capabilities granted to BPF programs, and thus the ways in which they can be used to subvert the security of a system. Giving a full overview of all the available switches and their effect would exceed the scope of this post, however, we will mention some knobs that can be turned to stop the abuses mentioned below.
If you search for the term “BPF malware” these days, you will find rather sensational articles with titles like “eBPF: A new frontier for malware”, “How BPF-Enabled Malware Works”, “eBPF Offensive Capabilities – Get Ready for Next-gen Malware”, “Nothing is Safe Anymore - Beware of the “eBPF Trojan Horse” or “HOW DOES EBPF MALWARE PERFORM AGAINST STAR LAB’S KEVLAR EMBEDDED SECURITY?”. Needless to say, that they contain hardly any useful information. The truth is that we are not aware of any reports of in-the-wild malware using BPF. Nevertheless, there is no shortage in open source PoC BPF malwares on GitHub. The two biggest ones are probably ebpfkit and TripeCross , however, there are many smaller projects like nysm , sshd_backdoor , boopkit , pamspy , or bad bpf as well as snippet collections like nccgroup’s bpf tools , Offensive-BPF . Researchers also used malicious BPF programs to escape container isolation in multiple real-world cloud environments.
There are a couple of core shenanigans that those malwares are constructed around, three of which we will briefly describe here.
It is possible to transparently (for user space) skip the execution of any system call or to manipulate just the return value after it was executed. This is since BPF can be used for the purpose of error injection
. To be precise, any function that is annotated with the ALLOW_ERROR_INJECTION macro can be manipulated in this way, and every system call is automatically annotated
via the macro that defines it. One would hope that the corresponding configurations BPF_KPROBE_OVERRIDE
and CONFIG_FUNCTION_ERROR_INJECTION
would not be enabled in kernels shipped to end users, but they are. There are many things that one can do by lying to user space in this way, one example would be to block the sending of all signals to a specific process, e.g., to protect it from being killed
. Interestingly, the same helper is also used by BPF-based security solutions like tetragon
, which are deployed in production cloud environments.
Another common primitive is to write to memory of the current process, which gives attackers the power to perform all sorts of interesting memory corruptions. One of the more original ideas is to inject code
into a process by writing a ROP chain onto its stack. The chain sets up everything to load a shared library and cleanly resumes the process afterwards. More generally, the helper bpf_probe_write_user is involved in many techniques to hide objects, e.g., sockets or BPF programs, from user space or when manipulating apparent file and directory contents, e.g., /proc, /etc/sudoers or ~/.ssh/authorized_keys. In particular, those apparent modifications cannot be caught with file system forensics as they are only happening in the memory of the process that attempts to access the resource, e.g., see textreplace
for an example that allows arbitrary apparent modifications of file contents. While there are in fact a couple of legitimate programs (like the Datadog-agent
) using this function, it is probably wise to enable CONFIG_LOCK_DOWN_KERNEL_FORCE_INTEGRITY
before compilation.
A rather peculiar aspect of BPF malware is how it communicates over the network. BPF programs are not able to initiate network connections by themselves, but as one of the main applications of BPF is in the networking subsystem, they have far-reaching capabilities when it comes to managing existing traffic. For example, XDP programs get their hands on packets very early in the receive path, long before mechanisms like netfilter, which is much further up the network stack, get a chance to see them. In fact, there are high-end NICs that support running BPF programs on the device’s proces
rather than the host CPU. Furthermore, programs that handle packets can usually modify, reroute, or drop them. In combination, this is often used to receive C2 commands while at the same time hiding the corresponding packets from the rest of the kernel by modifying or dropping them. In addition, BPF’s easy programmability makes it simple to implement complex, stateful triggers. To exfiltrate data from the system, the contents, and potentially also the recipient data, of outgoing packets are modified, for example by traffic control (tc) hooks. For unreliable transport protocols higher layers will deal with the induced packet loss, while for TCP the retransmission mechanism ensures that applications will not be impacted. Turn off CONFIG_NET_CLS_BPF
and CONFIG_NET_ACT_BPF
to disable tc BPF programs.
While the currently charted BPF malware landscape is limited to hobby projects by security researchers and other interested individuals, it would unfortunately not be unheard of that the same projects are eventually discovered during real-world incidents. Advanced Linux malwares, on the other hand, will most likely choose to implement their own BPF programs when they believe that it is beneficial for their cause, for instance to avoid detection by using a mechanism that is not yet well known to the forensic community. Some excerpts from the recent talk by Kris Nova at DevOpsDays Kyiv give an interesting insight into the concerns that the Ukrainian computer security community had, and still has, regarding the use of BPF in Russian attacks on their systems.
It would be dishonest to claim that there is a general schema that you can follow while analyzing an incident to discover all malicious BPF programs. As so often, the boundaries between monitoring software, live patches, security solutions and malware are not clearly defined, e.g., in addition to bpf_override_retun tetragon
also uses bpf_send_singal. The first step could be to obtain a baseline of expected BPF-related activity, and carefully analyze any deviations or anomalies. Additionally, a look at the kernel configuration can help to decide which kinds of malicious activity are fundamentally possible. Furthermore, programs that make use of possibly malicious helper functions, like bpf_probe_wite_user, bpf_send_signal, bpf_override_return, or bpf_skb_store_bytes should be reverse engineered
with particular scrutiny. In addition, there are some clear indicators of malicious activity, like the hiding of programs, which we will discuss in more detail below. Finally, once program signatures are upstreamed, it is highly recommended to enable and enforce them to lock down this attack surface.
From now on, we will shift gears and focus on the main topic of this post, hunting BPF malware in main memory images.
Aside: The bvp47 , Symbiote and BPFdoor rootkits are often said to be examples of BPF malware. However, they are using only what is now known as classic BPF, i.e., the old-school packet filtering programs used by programs like tcpdump.
Volatility Plugins
Volatility is a memory forensics framework that can be used to analyze physical memory images. It uses information about symbols and types of the operating system that was running on the imaged system to recover high-level information, like the list of running processes or open files, from the raw memory image.
Individual analyses are implemented as plugins that make use of the framework library as well as other plugins. Some of those plugins are closely modeled after core unix utilities, like the ps utility for listing processes, the ss utility for listing network connections or the lsmod utility for listing kernel modules. Other plugins implement checks that search for common traces of kernel rootkit activity, like the replacement of function pointers or inline hooks.
There may be multiple ways to obtain the same piece of information, and thus multiple plugins that, on first sight, serve the same purpose. Inconsistencies between the methods, however, could indicate malicious activity that tries to hide its presence or just be artifacts of imperfections in the acquisition process. In any case, inconsistencies are something an investigator should look into.
In this section we present seven Volatility plugins that we have developed to enable analysis of the BPF subsystem. Three of these are modelled after subcommands of the bpftool
utility and provide basic functionality. We then present three plugins that retrieve similar information from other sources and can thus be used to detect inconsistencies. Finally, we present a plugin that aggregates information from four other plugins to make it easier to interpret.
_Note: We published the source code for all of our plugins on GitHub . We would love to see your contributions there! :)
Listing Programs, Maps & Links
Arguably the most basic task that you could think of is simply listing the programs that have been loaded into the BPF VM. We will start by doing this on a live system, feel free to follow along in order to discover what your distribution or additional packages that you installed have already loaded.
Live System
The bpftool user-space utility allows admins to interact with the BPF subsystem. One of the most basic tasks it supports is the listing of all loaded BPF programs, maps, BTF sections, or links. We are sometimes going to refer to these things collectively as BPF objects. Roughly speaking, links are a mechanism to connect a loaded program to a point where it is being invoked, and BTF is a condensed form of DWARF debug information.
Lets start with an example to get familiar with the information that is displayed (run btftool as root):
# bpftool prog list
[...]
22: lsm  name restrict_filesystems  tag 713a545fe0530ce7  gpl
	loaded_at 2023-11-26T10:31:42+0100  uid 0
	xlated 560B  jited 305B  memlock 4096B  map_ids 13
	btf_id 53
[...]
From left-to-right and top-to-bottom we have: ID used as an identifier for user-space, program type, program name, tag that is a SHA1 hash over the bytecode, license, program load timestamp, uid of process that loaded it, size of the bytecode, size of the jited code, memory blocked by the program, ids of the maps that the program is using, ids to the BTF information for the program.
We can also inspect the bytecode
# bpftool prog dump xlated id 22
int restrict_filesystems(unsigned long long * ctx):
; int BPF_PROG(restrict_filesystems, struct file *file, int ret)
   0: (79) r3 = *(u64 *)(r1 +0)
   1: (79) r0 = *(u64 *)(r1 +8)
   2: (b7) r1 = 0
[...]
where each line is the pseudocode of a BPF assembly instruction and we even have line info, which is also stored in the attached BTF information. We can also dump the jited version and confirm that is is essentially a one-to-one translation to x86_64 machine code (depending on the architecture your kernel runs on):
# bpftool prog dump jited id 22
int restrict_filesystems(unsigned long long * ctx):
bpf_prog_713a545fe0530ce7_restrict_filesystems:
; int BPF_PROG(restrict_filesystems, struct file *file, int ret)
   0:	endbr64
   4:	nopl	(%rax,%rax)
   9:	nop
   b:	pushq	%rbp
   c:	movq	%rsp, %rbp
   f:	endbr64
  13:	subq	$24, %rsp
  1a:	pushq	%rbx
  1b:	pushq	%r13
  1d:	movq	(%rdi), %rdx
  21:	movq	8(%rdi), %rax
  25:	xorl	%edi, %edi
[...]
Furthermore, we can display basic information about the maps used by the program
# bpftool map list id 13
13: hash_of_maps  name cgroup_hash  flags 0x0
	key 8B  value 4B  max_entries 2048  memlock 165920B
as well as their contents (which are quite boring in this case).
# bpftool map dump id 13
Found 0 elements
We can also get information about the variables and types (BTF) defined in the program. This is somewhat comparable to the DWARF debug information that comes with some binaries - just that it is harder to strip since its needed by the BPF VM.
# bpftool btf dump id 53
[1] PTR '(anon)' type_id=3
[2] INT 'int' size=4 bits_offset=0 nr_bits=32 encoding=SIGNED
[3] ARRAY '(anon)' type_id=2 index_type_id=4 nr_elems=13
[4] INT '__ARRAY_SIZE_TYPE__' size=4 bits_offset=0 nr_bits=32 encoding=(none)
[5] PTR '(anon)' type_id=6
[6] TYPEDEF 'uint64_t' type_id=7
[7] TYPEDEF '__uint64_t' type_id=8
[8] INT 'unsigned long' size=8 bits_offset=0 nr_bits=64 encoding=(none)
[9] PTR '(anon)' type_id=10
[10] TYPEDEF 'uint32_t' type_id=11
[11] TYPEDEF '__uint32_t' type_id=12
[12] INT 'unsigned int' size=4 bits_offset=0 nr_bits=32 encoding=(none)
[13] STRUCT '(anon)' size=24 vlen=3
	'type' type_id=1 bits_offset=0
	'key' type_id=5 bits_offset=64
	'value' type_id=9 bits_offset=128
[...]
As we said earlier, links are what connects a loaded program to a point that invokes it.
# bpftool link list
[...]
3: tracing  prog 22
	prog_type lsm  attach_type lsm_mac
	target_obj_id 1  target_btf_id 82856
Again, from left-to-right and top-to-bottom we have: ID, type, attached program’s ID, program’s load type, type that program was attached with, ID of the BTF object that the following field refers to, ID of the type that the program is attached to (functions can also have BTF entries). Note that everything but the first line depends on the type of link that is examined. To find the point where the program is called by the kernel we can inspect the relevant BTF object (the kernel’s in this case).
# bpftool btf dump id 1 | rg 82856
[82856] FUNC 'bpf_lsm_file_open' type_id=16712 linkage=static
Thus we can conclude that the program is invoked early in the do_dentry_open function via the security_file_open LSM hook and that its return value decides whether the process will be allowed to open the file (we’re skipping some steps here, see our earlier article
for the full story).
We performed this little “live investigation” on a laptop running Arch Linux with kernel 6.6.2-arch1-1 and the program wasn’t malware but rather loaded by systemd on boot. You can find the commit that introduced the feature here . Again, you can see that in the future there will be more legitimate BPF programs running on your systems (servers, desktops and mobiles) than you might think!
Memory Image
As a first step towards BPF memory forensics it would be nice to be able to perform the above investigation on a memory image. We will now introduce three plugins that aim to make this possible.
We already saw that all sorts of BPF objects are identified by an ID. Internally, these IDs are allocated using the IDR mechanism
, a core kernel API. For that purpose, three variables are defined at the top of /kernel/bpf/syscall.c.
[...]
static DEFINE_IDR(prog_idr);
static DEFINE_SPINLOCK(prog_idr_lock);
static DEFINE_IDR(map_idr);
static DEFINE_SPINLOCK(map_idr_lock);
static DEFINE_IDR(link_idr);
static DEFINE_SPINLOCK(link_idr_lock);
[...]
Under the hood, the ID allocation mechanism uses an extensible array (xarray)
, a tree-like data structure that is rooted in the idr_rt member of the structure that is defined by the macro. The ID of a new object is simply an unused index into the array, and the value stored at this index is a pointer to a structure that describes it. Thus, we can re-create the listing capabilities of bpftool by simply iterating the array. You can find the code that does so in the XArray
class.
Dereferencing the array entries leads us to structures that hold most of the information displayed by bpftool earlier.
Entries of the prog_idr
point to objects of type bpf_prog
, the aux member of this type points to a structure
that hols additional information about the program. We can see how the information bpftool displays is generated from these structures in the bpf_prog_get_info_by_fd
function by filling a bpf_prog_info
struct. The plugin bpf_listprogs
re-implements some of the logic of this functions and displays the following pieces of information.
columns: list[tuple[str, type]] = [
    ("OFFSET (V)", str),
    ("ID", int),
    ("TYPE", str),
    ("NAME", str),
    ("TAG", str),
    ("LOADED AT", int),
    ("MAP IDs", str),
    ("BTF ID", int),
    ("HELPERS", str),
]
Some comments are in order:
OFFSET (V)are the low 6 bytes of thebpf_progstructure’s virtual address. This is useful as a unique identifier of the structure.LOADED ATis the number of nanoseconds since boot when the program was loaded. Converting it to an absolute timestamp requires parsing additional kernel time-keeping structures and is not in scope for this plugin. There exist Volatility patches that add this functionality but they are not upstream yet. Once they are, it should be trivial to convert this field to match thebpftooloutput.HELPERSis a field that is not reported bybpftool. It displays a list of all the kernel functions that are called by the BPF program, i.e., BPF helpers and kfuncs, and is helpful to quickly identify programs that use possibly malicious or non-standard helpers.- The reporting of memory utilization is omitted as we consider it to be less important for forensic investigations, however, it would be easy to add.
The second bpftool functionality the plugin supports is the dumping of programs in bytecode and jited forms. To dump the machine code of the program, we follow the bpf_func pointer in the bpf_prog structure, which points to the entrypoint of the jited BPF program. The length of the machine code is stored in the jited_len field of the same structure. While we support dumping the raw bytes to a file, their analysis is tedious due to missing symbol information. Thus, we also support disassembling the program and annotating all occurring addresses with the corresponding symbol, which makes the programs much easier to analyze.
Dumping the BPF bytecode is straightforward as well. The flexible insni array member of the bpf_prog structure holds the bytecode instructions and the len field holds their number. Here, we also support dumping the raw and disassembled bytecode. However, the additional symbol annotations are not implemented. As the bytecode is not “what actually runs”, we consider this information more susceptible to anti-forensic tampering and thus focused on the machine code, which is what is executed when invoking the program.
Note: We use Capstone for disassembling the BPF bytecode. Unfortunately, Capstone’s BPF architecture is outdated and thus bytecode is sometimes not disassembled entirely. As a workaround, you can dump the raw bytes and use another tool to disassemble them.
Entries of the map_idr
point to bpf_map
objects. The bpf_map_info
structure parsed by bpftool is filled in bpf_map_get_info_by_fd
and the plugin bpf_listmaps
is simply copying the logic to display the following pieces of information.
columns: list[tuple[str, Any]] = [
        ("OFFSET (V)", str),
        ("ID", int),
        ("TYPE", str),
        ("NAME", str),
        ("KEY SIZE", int),
        ("VALUE SIZE", int),
        ("MAX ENTRIES", int),
]
Dumping the contents of maps is hard due to the diversity in map types. Each map type requires its own handling, beginning with manually downcasting the bpf_map object to the correct container type. One approach to avoid implementing each lookup mechanism separately, would be through emulation of the map_get_next_key
and bpf_map_copy_value
kernel functions, where the former is a function pointer found in the map’s operations structure. However, this is not in scope for the current plugin.
Furthermore, the dumping could be enhanced by utilizing the BTF information that is optionally attached to the map to properly display keys and values, similar to the bpf_snprintf_btf
helper that can be used to pretty-print objects using their BTF information.
We implemented the dumping for the most straightforward map type - arrays - but the plugin does not support dumping other types of maps.
Entries of the link_idr
point to objects of type bpf_link
. Again, there is an informational structure, bpf_link_info
, which is this time filled in the bpf_link_get_info_by_fd
function. By analyzing this function, we wrote the bpf_listlinks
plugin that retrieves the following pieces of information.
columns: list[tuple[str, Any]] = [
    ("OFFSET (V)", str),
    ("ID", int),
    ("TYPE", str),
    ("PROG", int),
    ("ATTACH", str),
]
Here, the last column is obtained by mimicking the virtual call to link->ops->fill_link_info that adds link-type specific information about the associated attachment point, e.g., for tracing links it adds the BTF object and type IDs we saw earlier.
LSM Hooks
Our three listing plugins have one conceptual weakness in common: they rely entirely on information obtained by parsing the (prog|map|link)_idrs. However, the entire ID mechanism is in the user-facing part of the BPF subsystem, its simply a means for user space to refer to BPF objects in syscalls. Thus, our plugins are susceptible to trivial anti-forensic tampering.
In our research, we prototyped two anti-forensic methods that remove BPF objects from these structures while still keeping the corresponding program active in the kernel. First, the more straightforward way is to simply write a kernel module that uses standard APIs to remove IDs from the IDRs. The second one is based on the observation that the lifecycle of BPF objects is managed via reference counts. Thus, if we artificially increment the reference count of an object that (indirectly) holds references to all other objects that are required to operate a BPF program, e.g., a link, we can prevent the program’s destruction when all “regular” references are dropped.
One approach to counter these anti-forensic measures is to “approach from the other side”. Instead of relying on information from sources that are far detached from the actual program execution, we go to the very places and mechanisms that invoke the program. The downside is obviously that this low-level code is much more program-type and architecture specific, the results, on the other hand, are more robust.
In a previous blog post
we described the low-level details that lead up to the execution of BPF LSM programs in great detail. Based on this knowledge, we developed the bpf_lsm
plugin that can discover hidden BPF programs attached to security hooks. In short, the plugin checks the places where the kernel control flow may be diverted into the BPF VM for the presence of inline hooks. If they are found, it cross checks with the links IDR to see if there is a corresponding link, the absence of which is a strong indication of tampering. Additionally, the plugin is also valuable in the absence of tampering, as it shows you the exact program attachment point without the need to manually resolve BTF IDs. In particular, the plugin displays the number of attached programs and their IDs along with the name of the LSM hook where they are attached.
columns: list[tuple[str, type]] = [
    ("LSM HOOK", str),
    ("Nr. PROGS", int),
    ("IDs", str),
]
Networking Hooks
As we described above, traffic control (tc) programs are especially useful for exfiltrating information from infected machines, e.g., by hijacking existing TCP connections. Thus, the second plugin that obtains its information from more tamper resistant sources targets tc BPF programs. It only relies on the mini_Qdisc
structure that is used on the transmission and receive fast paths to look up queuing disciplines (qdisc) attached to a network device.
We use the ifconfig plugin
by Ofek Shaked and Amir Sheffer to obtain a list of all network devices. Then, we find the above-mentioned structure and use it to collect all BPF programs that are involved into qdiscs on this device. With kernel 6.3 the process of locating the mini_Qdisc from the network interface changed slightly due to the introduction of link-based attachment of tc programs, however, the plugin recognizes and handles both cases. Finally, the bpf_netdev
plugin displays the following information about each interface where at least one BPF program was found,
columns: list[tuple[str, type]] = [
    ("NAME", str),
    ("MAC ADDR", str),
    ("EGRESS", str),
    ("INGRESS", str),
]
where the EGRESS and INGRESS hold the IDs of the programs that process packets flowing into the respective direction.
Finding Processes
Yet another way to discover BPF objects is through the processes that hold on to them. As with many other resources, programs, links, maps, and btf are represented to processes as file descriptors. They can be used to act on the object, retrieve information about it, and serve as a mechanism to clean up after processes that did not exit gracefully. Furthermore, an investigator might want to find out which process holds on to a specific BPF object in order to investigate this process further.
Thus, the bpf_listprocs
plugin displays the following pieces of information for every process that holds on to at least one BPF object via a file descriptor.
columns: list[tuple[str, type]] = [
    ("PID", int),
    ("COMM", str),
    ("PROGS", str),
    ("MAPS", str),
    ("LINKS", str),
]
Here, the PROGS. MAPS, and LINKS columns display the IDs of the respective objects. This list is generated by iterating over all file descriptors and the associated file
structures. BPF objects are identified by checking the file operations f_op pointer, and the corresponding bpf_(prog|map|link) structures are found by following the pointer stored in the private member.
Not every BPF object must be reachable from the process list, however. They can, for example, also be represented as files under the special bpf filesystem, which is usually mounted at /sys/fs/bpf, or processes can close file descriptors and the object will remain alive as long as there are other references to it.
Connecting the Dots
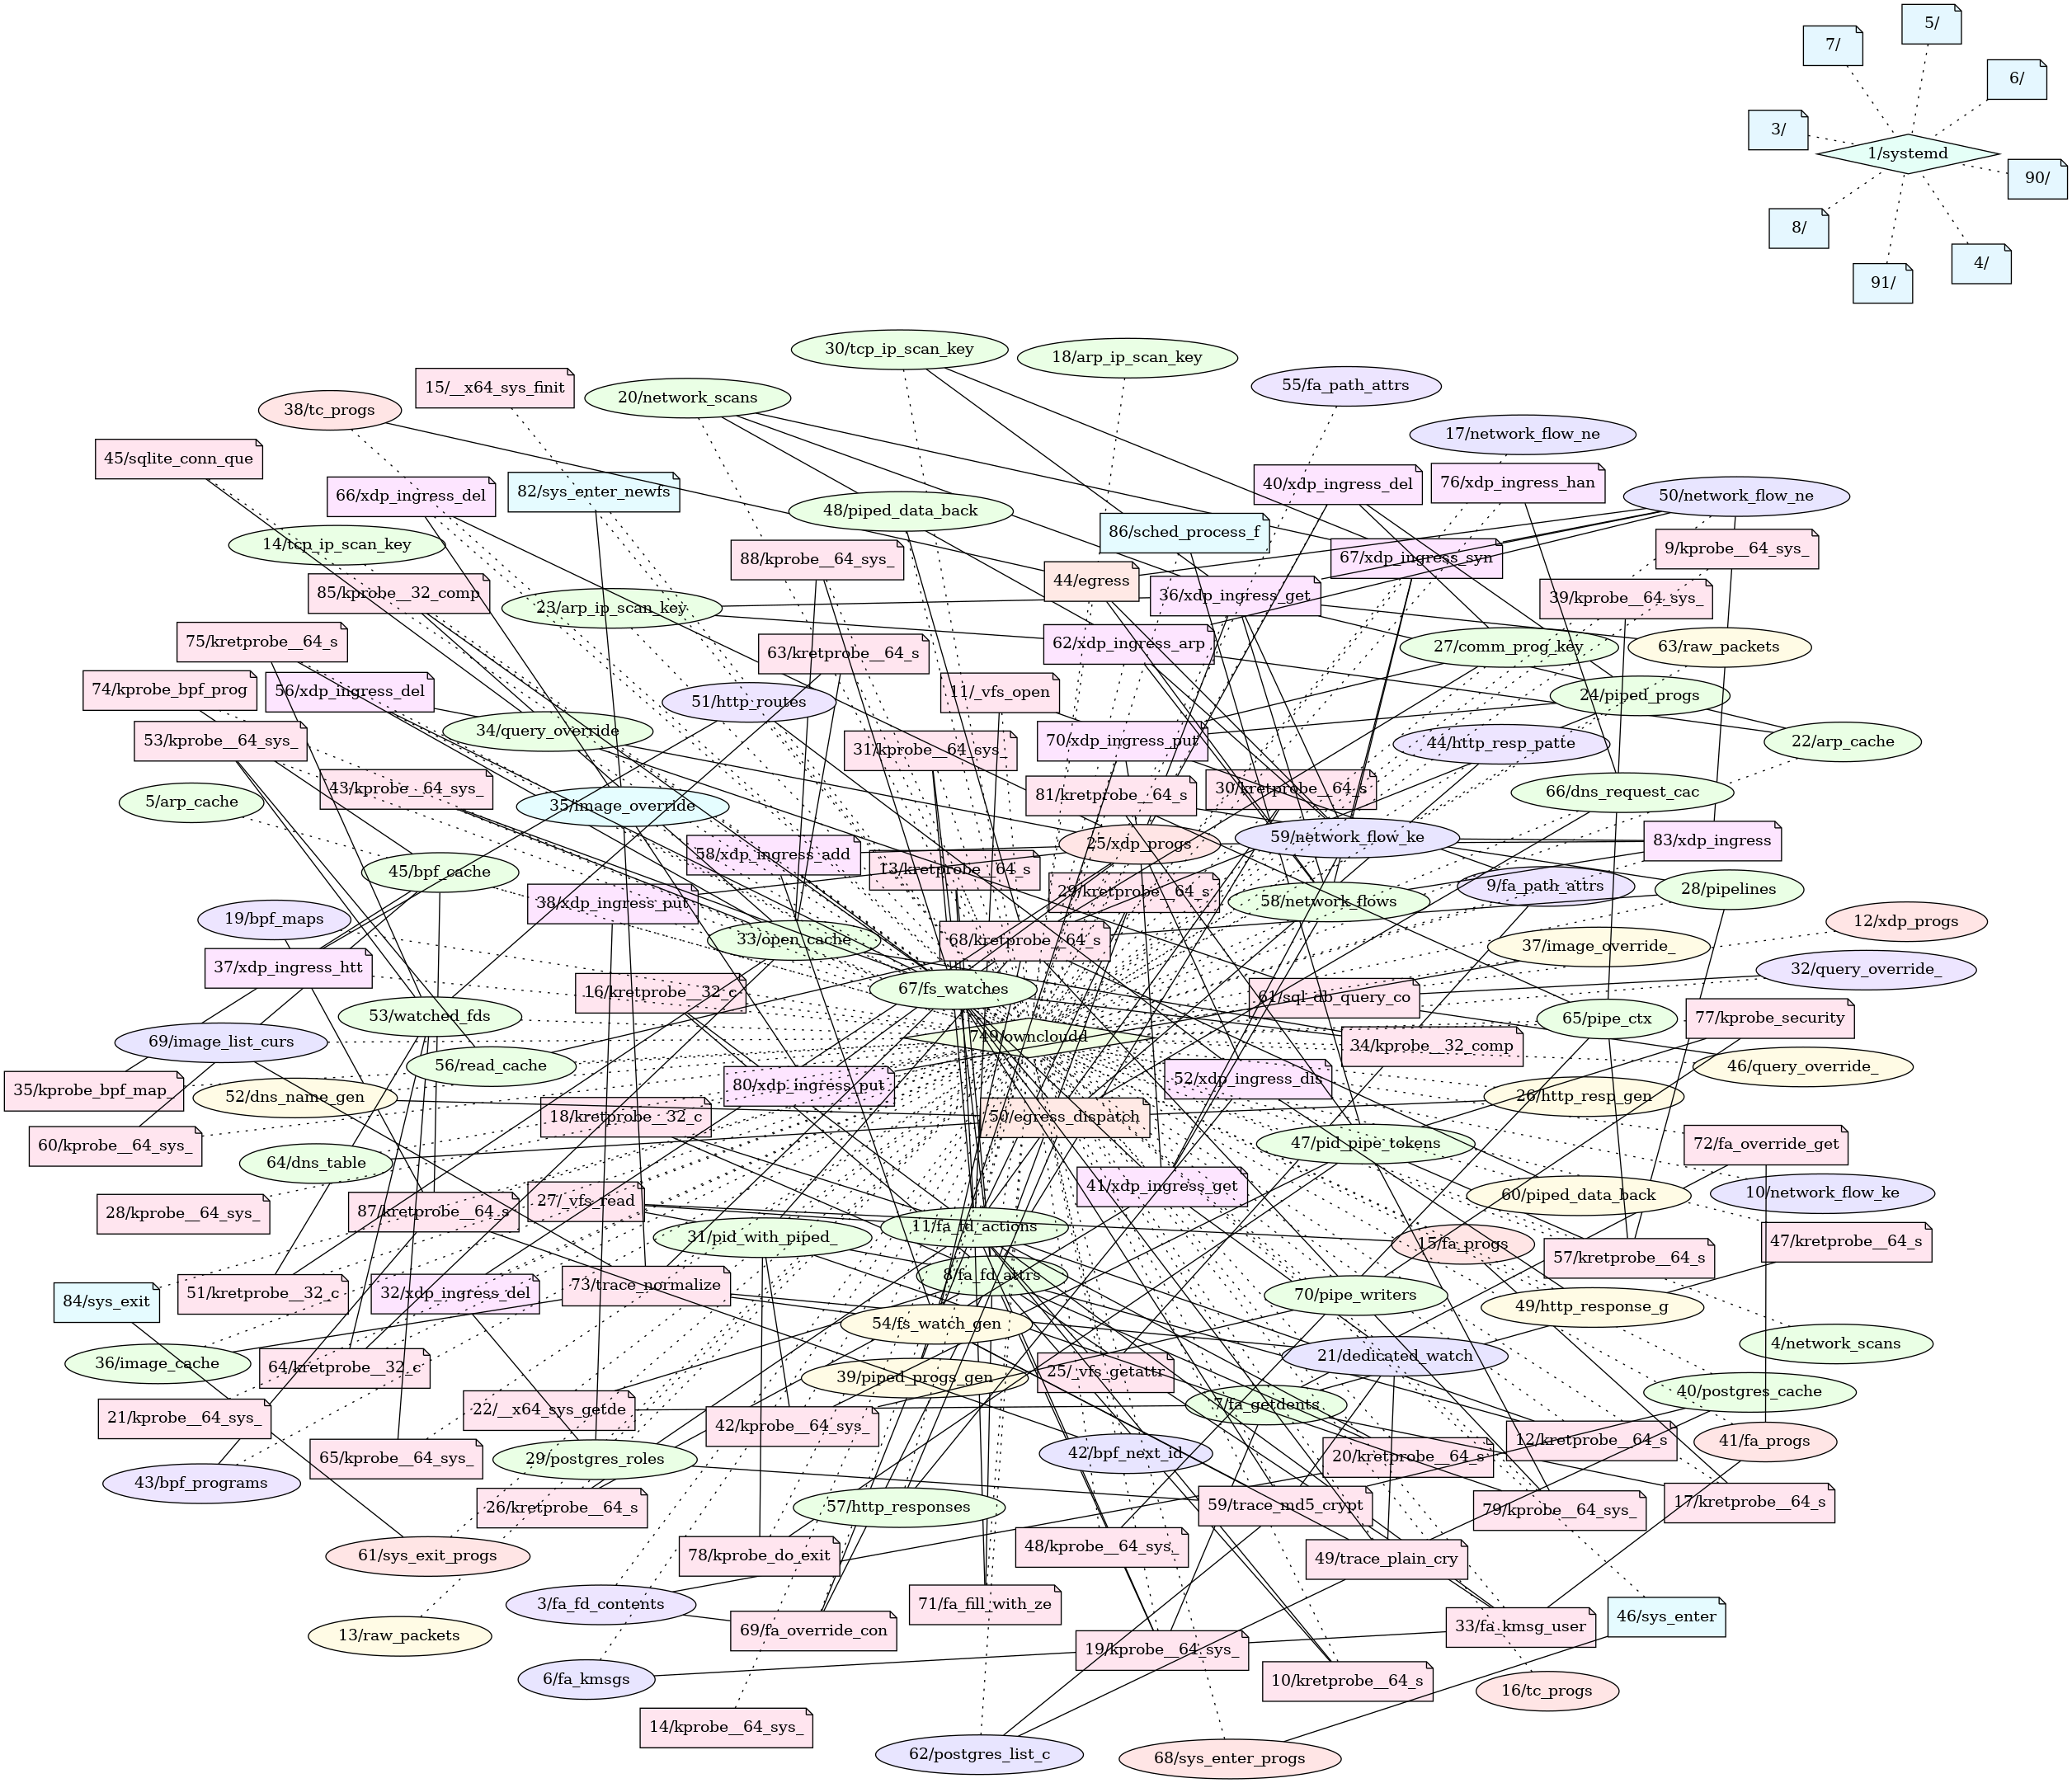
Finally, we would like to present the bpf_graph
plugin, a meta analysis that we have build on top of the four listing plugins. As its name suggest, its goal is to visualize the state of the BPF subsystem as a graph.
There are four types of nodes in this graph: programs, maps, links and processes. Different node types are distinguished by shape. Within a node type, the different program/map/link types are distinguished by color and process nodes are colored based on their process ID (PID). Furthermore, map and program nodes are labeled with the ID and name of the object, link nodes are labeled with the ID and attachment information of the link, and process nodes receive the PID and comm (name of the user-space program binary) of their process as labels.
There are three types of edges to establish relationships between nodes: file descriptor, link, and map. File descriptor edges are dotted and connect processes to BPF objects that they have an open fd for. Link edges are dashed and connect BPF links to the program they reference. Finally, map edges are drawn solid and connect maps to all of the programs that use them.
Especially for large applications with hundreds or even thousands of objects, it is essential to be able to filter the graph to make it useful. We have therefore implemented two additional options that can be passed to the plugin. First, you can pass a list of node types to include in the output. Second, you can pass a list of nodes, and only the connected components that contain at least one of those nodes will be drawn.
The idea of this plugin is to make the information of the four listing plugins more accessible to investigators by combining it into a single picture. This is especially useful for complex applications with possibly hundreds of programs and maps, or on busy systems where many different processes have loaded BPF programs.
Plugin output comes in two forms, a dot-format encoding of the graph, where each BPF object node has metadata containing all of the plugin columns, and as a picture of the graph, drawn with a default layout algorithm. The latter should suffice for most users, but the former allows advanced use-cases to do further processing.
Note: We provide standalone documentation for all plugins in our project on GitHub.
Case Study
In this section we will use the plugins to examine the memory image of a system with a high level of BPF activity. To get a diverse set of small BPF applications we launched the example programs that come with libbpf-bootstrap
and some of the kernel self-tests. You can download the memory image
and symbols
to follow along. If you prefer to analyze a single, large application have a look at the krie example in our plugin documentation
.
A good first step is to use the graph plugin to get an overview of the subsystem (# vol -f /io/dumps/debian-bookworm-6.1.0-13-amd64_all.raw linux.bpf_graph).
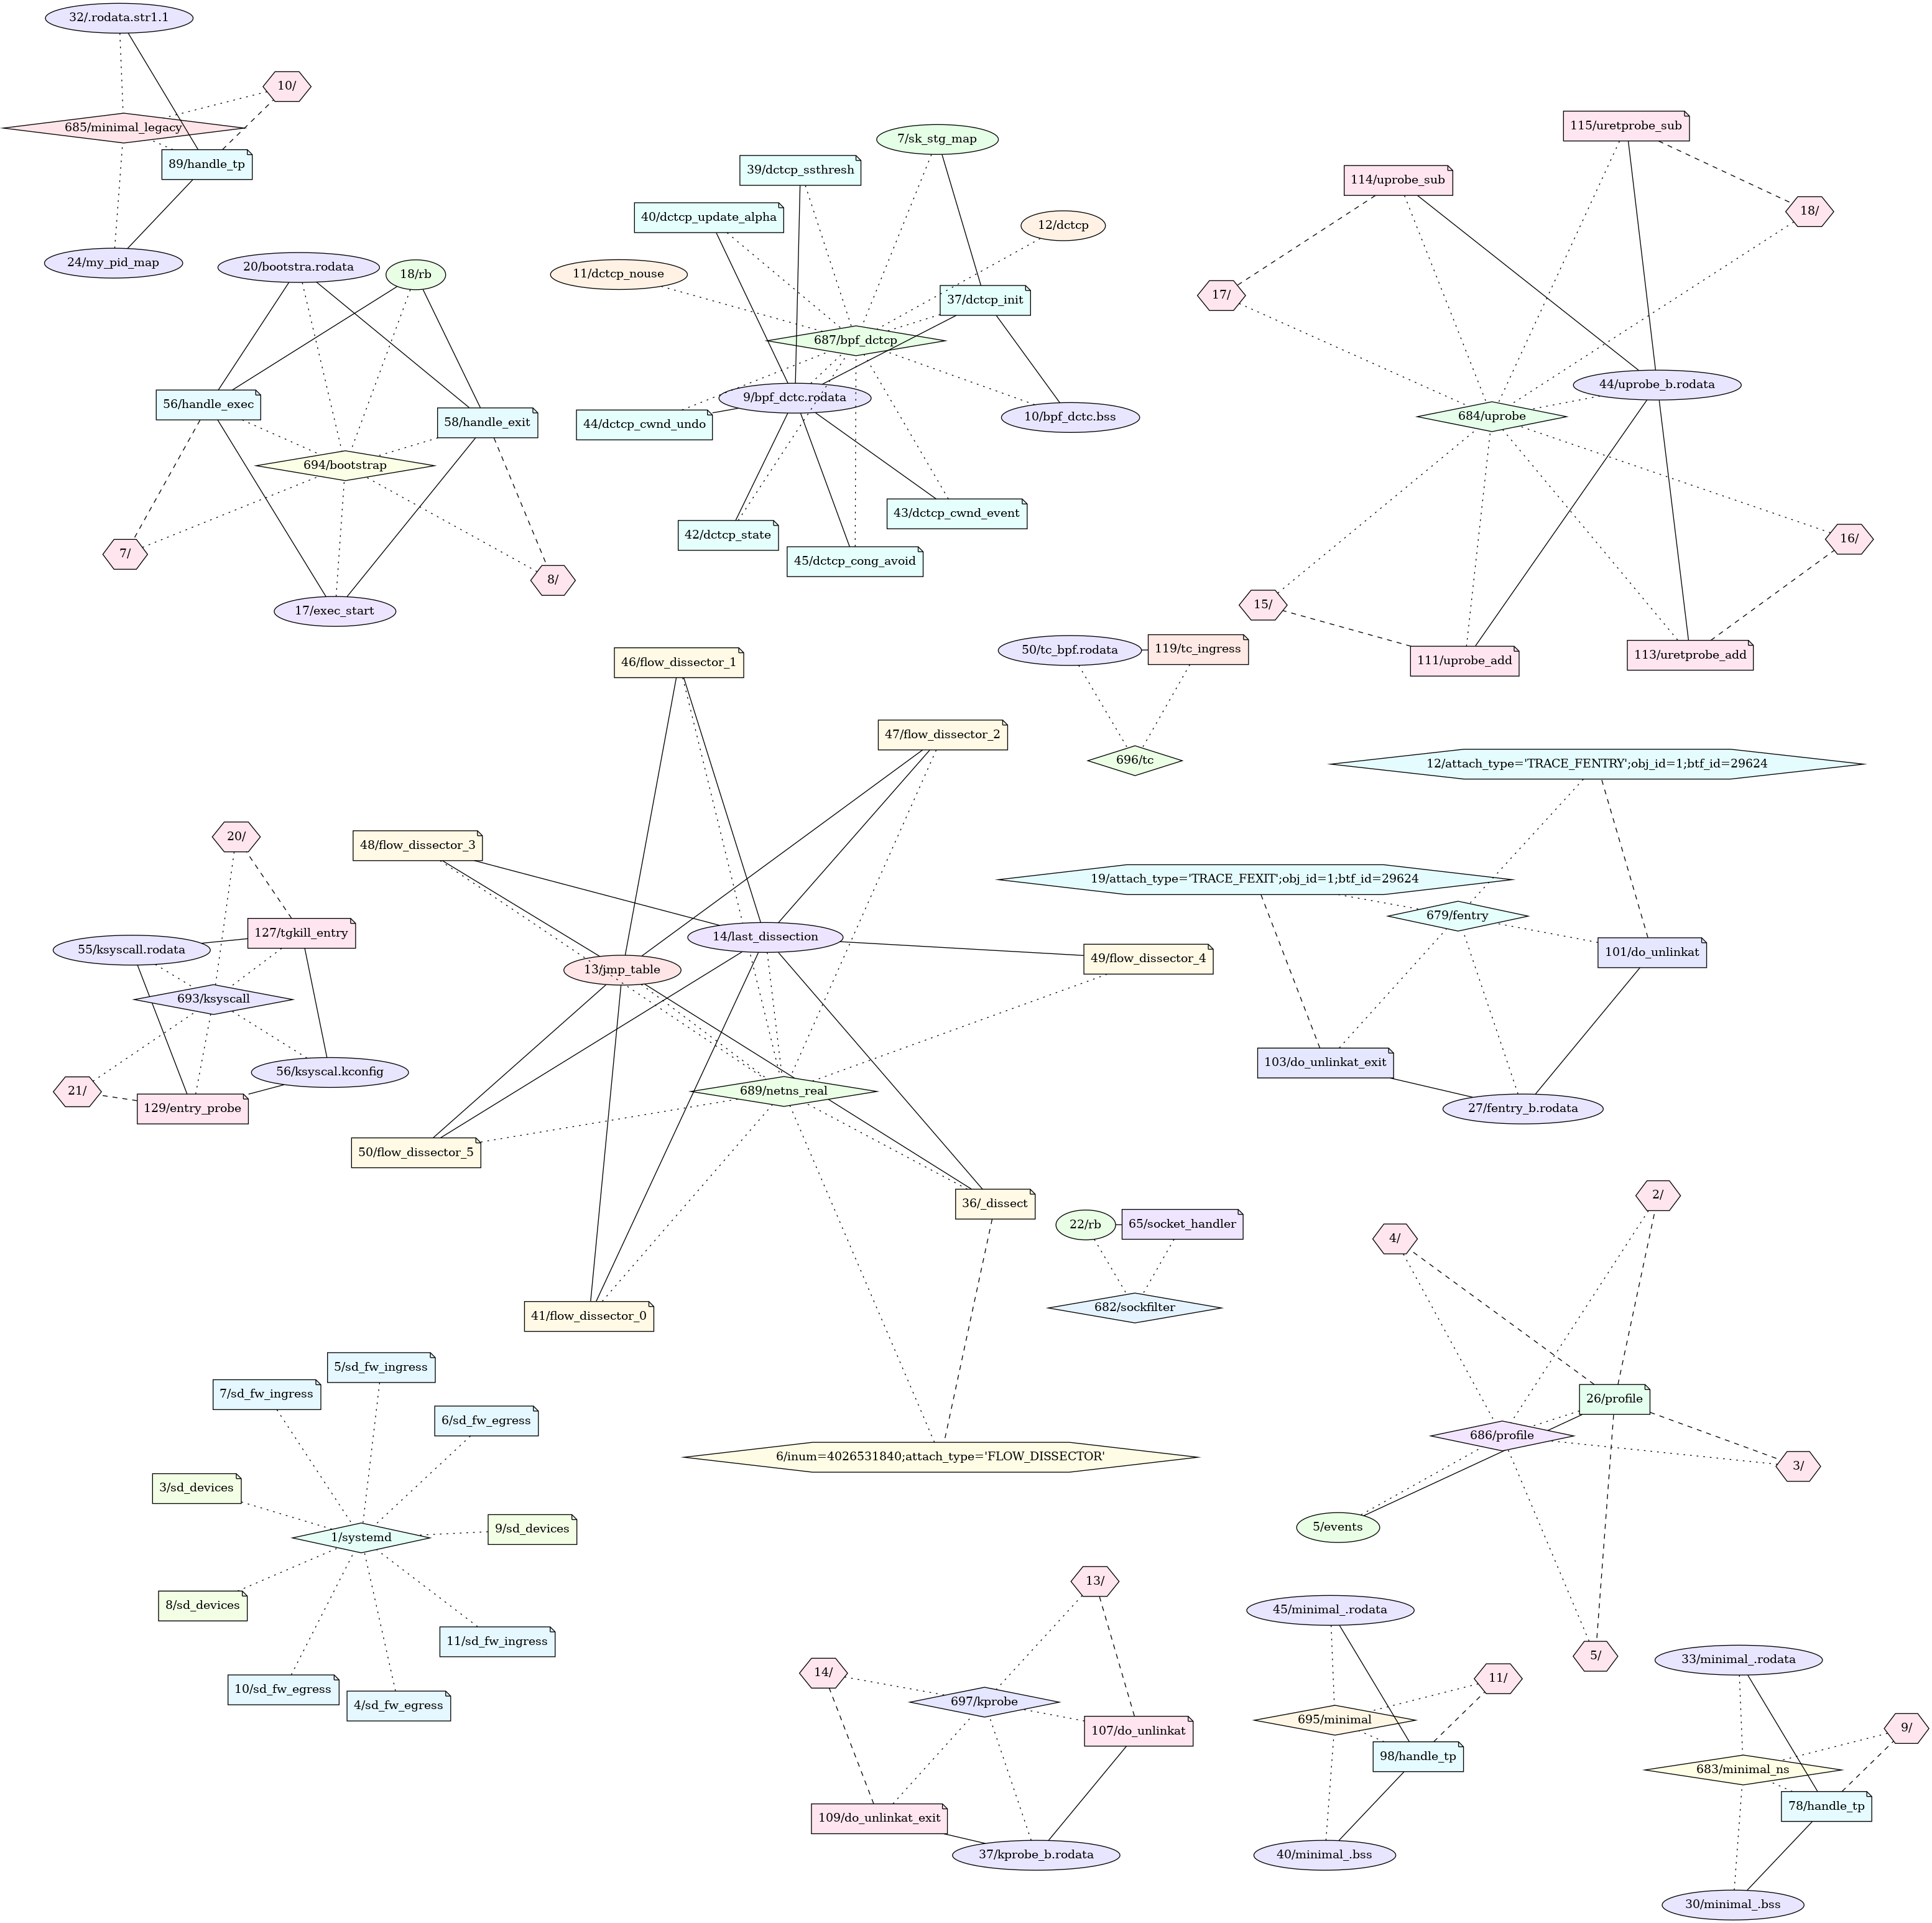
As we can see, there are several components corresponding to different processes, each of which holds a number of BPF resources. Let us begin by examining the “Hello, World” example of BPF, the minimal
program:
// SPDX-License-Identifier: GPL-2.0 OR BSD-3-Clause
/* Copyright (c) 2020 Facebook */
#include <linux/bpf.h>
#include <bpf/bpf_helpers.h>

char LICENSE[] SEC("license") = "Dual BSD/GPL";

int my_pid = 0;

SEC("tp/syscalls/sys_enter_write")
int handle_tp(void *ctx)
{
	int pid = bpf_get_current_pid_tgid() >> 32;

	if (pid != my_pid)
		return 0;

	bpf_printk("BPF triggered from PID %d.\n", pid);

	return 0;
}
The above source code is compiled with clang to produce an ELF relocatable object file. It contains the BPF bytecode along with additional information, like BTF sections, CORE relocations, programs as well as their attachment mechanisms and points, maps that are used and so on. This ELF is then embedded into a user space program that statically links against libbpf. At runtime, it passed the ELF to libbpf, which takes care of all the relocations and kernel interactions required to wire up the program to the BPF VM.
With the above C code in the back of our heads, we can now have a look at the relevant component of live system’s BPF object graph. To limit the output of the plugin to the connected components that contain certain nodes, we can add the --components flag to the invocation and give it a list of nodes (the format is <node_type>-<id> where node_type is in {map,link,prog,proc} and id is the BPF object ID or PID).
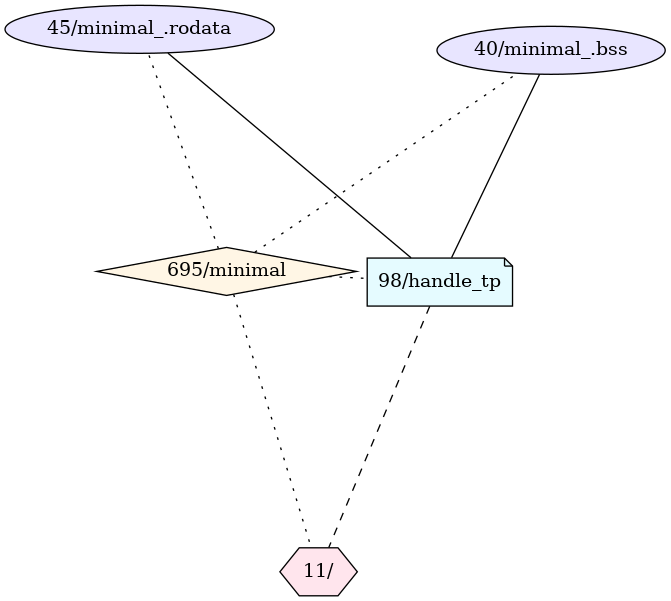
As we can see, the ELF has caused libbpf to create a program, two maps and a link while loading. We can now use our plugins to gather more information about each object. Let’s start with the program itself.
# vol -f /io/dumps/debian-bookworm-6.1.0-13-amd64_all.raw linux.bpf_listprogs --id 98 --dump-jited --dump-xlated
Volatility 3 Framework 2.5.0
Progress:  100.00               Stacking attempts finished
OFFSET (V)      ID      TYPE    NAME    TAG     LOADED AT       MAP IDs BTF ID  HELPERS

0xbce500673000  98      TRACEPOINT      handle_tp       6a5dcef153b1001e        1417821088492   40,45   196     bpf_get_current_pid_tgid,bpf_trace_printk
By looking at the last column we can see that it is indeed using two kernel helper functions, where the apparent call to bpf_printk turns out to be a macro that expands to bpf_trace_printk. If we look at the program byte and the machine code side by side, we can discover a few things.
# cat .prog_0xbce500673000_98_bdisasm
0x0: 85 00 00 00 10 b2 02 00                         call 0x2b210
0x8: 77 00 00 00 20 00 00 00                         rsh64 r0, 0x20
0x10: 18 01 00 00 00 a0 49 00 00 00 00 00 e5 bc ff ff lddw r1, 0xffffbce50049a000
0x20: 61 11 00 00 00 00 00 00                         ldxw r1, [r1]
0x28: 5d 01 05 00 00 00 00 00                         jne r1, r0, +0x5
0x30: 18 01 00 00 10 83 83 f5 00 00 00 00 7b 9b ff ff lddw r1, 0xffff9b7bf5838310
0x40: b7 02 00 00 1c 00 00 00                         mov64 r2, 0x1c
0x48: bf 03 00 00 00 00 00 00                         mov64 r3, r0
0x50: 85 00 00 00 80 0c ff ff                         call 0xffff0c80
0x58: b7 00 00 00 00 00 00 00                         mov64 r0, 0x0
0x60: 95 00 00 00 00 00 00 00                         exit

# cat .prog_0xbce500673000_98_mdisasm

handle_tp:
 0xffffc03772a0: 0f 1f 44 00 00                               nop dword ptr [rax + rax]
 0xffffc03772a5: 66 90                                        nop
 0xffffc03772a7: 55                                           push rbp
 0xffffc03772a8: 48 89 e5                                     mov rbp, rsp
 0xffffc03772ab: e8 d0 fc aa f1                               call 0xffffb1e26f80       # bpf_get_current_pid_tgid
 0xffffc03772b0: 48 c1 e8 20                                  shr rax, 0x20
 0xffffc03772b4: 48 bf 00 a0 49 00 e5 bc ff ff                movabs rdi, 0xffffbce50049a000    # minimal_.bss + 0x110
 0xffffc03772be: 8b 7f 00                                     mov edi, dword ptr [rdi]
 0xffffc03772c1: 48 39 c7                                     cmp rdi, rax
 0xffffc03772c4: 75 17                                        jne 0xffffc03772dd        # handle_tp + 0x3d
 0xffffc03772c6: 48 bf 10 83 83 f5 7b 9b ff ff                movabs rdi, 0xffff9b7bf5838310    # minimal_.rodata + 0x110
 0xffffc03772d0: be 1c 00 00 00                               mov esi, 0x1c
 0xffffc03772d5: 48 89 c2                                     mov rdx, rax
 0xffffc03772d8: e8 13 57 a7 f1                               call 0xffffb1dec9f0       # bpf_trace_printk
 0xffffc03772dd: 31 c0                                        xor eax, eax
 0xffffc03772df: c9                                           leave
 0xffffc03772e0: c3                                           ret
 0xffffc03772e1: cc                                           int3
The first lesson here is probably that symbol annotations are useful :). As expected, when ignoring the prologue and epilogue inserted by the JIT-compiler, the translation between BPF and x86_64 is essentially one-to-one. Furthermore, uses of global C variables like my_pid or the format string result in direct references to kernel memory, where the closest preceding symbols are the minimal_.bss’s and minimal_.rodata’s bpf_map structures, respectively. For simple array maps, the bpf_map structure resides at the beginning of a buffer that also holds the array data, 0x110 is simply the offset at which the map’s payload data starts. More generally, libbpf will automatically create maps to hold the variables living in the .data, .rodata, and .bss sections.
Dumping the map contents confirms that the .bss map holds the minimal process’s PID while the .rodata map contains the format string.
# vol -f /io/dumps/debian-bookworm-6.1.0-13-amd64_all.raw linux.bpf_listmaps --id 45 40 --dump
Volatility 3 Framework 2.5.0
Progress:  100.00               Stacking attempts finished
OFFSET (V)      ID      TYPE    NAME    KEY SIZE        VALUE SIZE      MAX ENTRIES

0xbce500499ef0  40      ARRAY   minimal_.bss    4       4       1
0x9b7bf5838200  45      ARRAY   minimal_.rodata 4       28      1
# cat .map_0xbce500499ef0_40
{"0": "section (.bss) = {\n (my_pid) (int) b'\\xb7\\x02\\x00\\x00'\n"}
# cat .map_0x9b7bf5838200_45
{"0": "section (.rodata) = {\n (handle_tp.____fmt) b'BPF triggered from PID %d.\\n\\x00'\n"}
In the source code we saw the directive SEC("tp/syscalls/sys_enter_write"), which instructs the compiler to place the handle_tp function’s BPF bytecode in an ELF section called "tp/syscalls/sys_enter_write". While loading, libbpf picks this up and creates a link that attaches the program to a perf event that is activated by the sys_enter_write tracepoint. We can inspect the link, but getting more information about the corresponding trace point is not yet implemented. Contributions are always highly welcome :)
# vol -f /io/dumps/debian-bookworm-6.1.0-13-amd64_all.raw linux.bpf_listlinks --id 11
Volatility 3 Framework 2.5.0
Progress:  100.00               Stacking attempts finished
OFFSET (V)      ID      TYPE    PROG    ATTACH

0x9b7bc2c09ae0  11      PERF_EVENT      98
Dissecting the “Hello, World” programm was useful to get an impression of what a BPF application looks like at runtime. Before concluding this section, we will have a look at a less minimalist example, the process with PID 687.
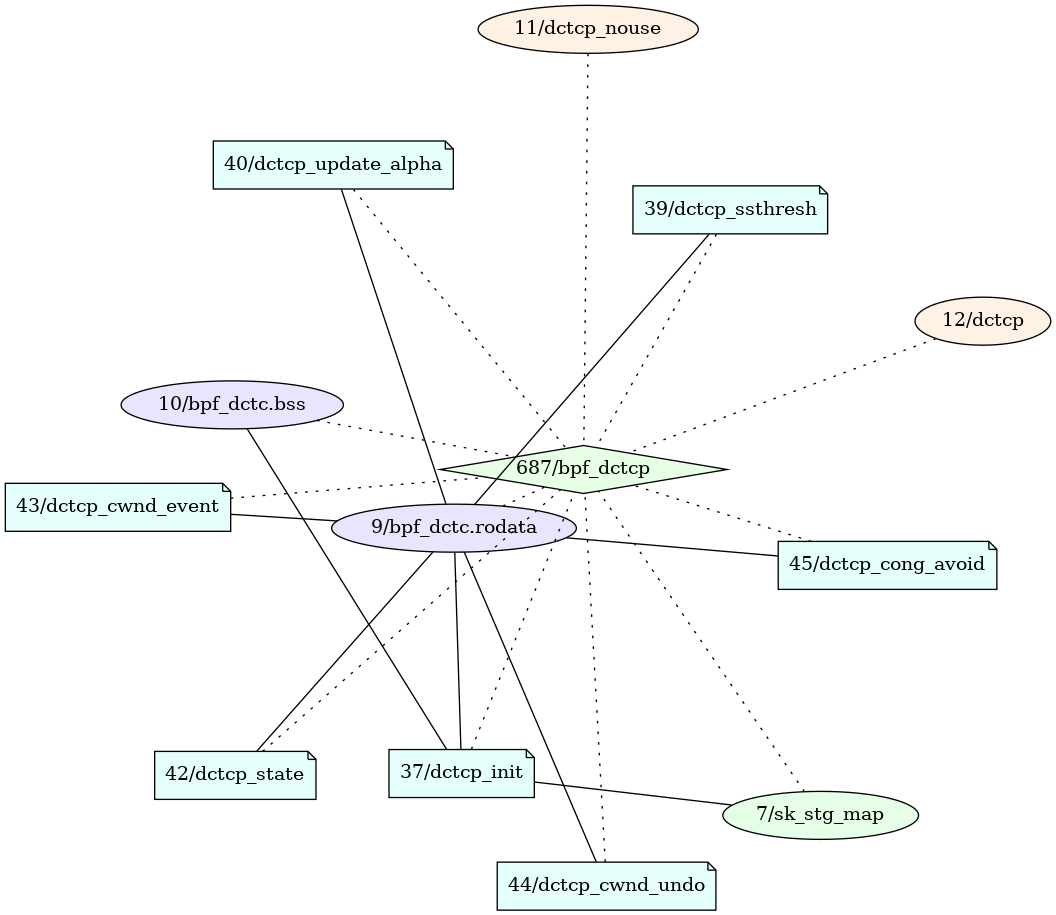
This process is one of the kernel self-tests. It tests a BPF feature that allows to load new function pointer tables used for dynamic dispatch (so called structure operations), where the individual operations are implemented as BPF programs, at runtime. The programs that implement the new operations can be recognized by their type STRUCT_OPS.
# vol -f /io/dumps/debian-bookworm-6.1.0-13-amd64_all.raw linux.bpf_listprogs --id 37 39 40 42 43 44 45
Volatility 3 Framework 2.5.0
Progress:  100.00               Stacking attempts finished
OFFSET (V)      ID      TYPE    NAME    TAG     LOADED AT       MAP IDs BTF ID  HELPERS

0xbce5003b7000  37      STRUCT_OPS      dctcp_init      562160e42a59841c        1417427431243   9,10,7  124     bpf_sk_storage_get,bpf_sk_storage_delete
0xbce50046b000  39      STRUCT_OPS      dctcp_ssthresh  cddbf7f9cf9b52d7        1417427590219   9       124
0xbce500473000  40      STRUCT_OPS      dctcp_update_alpha      6e84698df8007e42        1417427647277   9       124
0xbce500487000  42      STRUCT_OPS      dctcp_state     dc878de7981c438b        1417427777414   9       124
0xbce500493000  43      STRUCT_OPS      dctcp_cwnd_event        70cbe888b7ece66f        1417427888091   9       124     bpf_tcp_send_ack
0xbce5004e5000  44      STRUCT_OPS      dctcp_cwnd_undo 78b977678332d89f        1417428066805   9       124
0xbce5004eb000  45      STRUCT_OPS      dctcp_cong_avoid        20ff0d9ab24c8843        1417428109672   9       124     tcp_reno_cong_avoid
The mapping between the programs and the function pointer table they implement is realized through a special map of type STRUCT_OPS created by the process.
# vol -f /io/dumps/debian-bookworm-6.1.0-13-amd64_all.raw linux.bpf_listmaps --id 11 12
Volatility 3 Framework 2.5.0
Progress:  100.00               Stacking attempts finished
OFFSET (V)      ID      TYPE    NAME    KEY SIZE        VALUE SIZE      MAX ENTRIES

0x9b7bc3c41000  11      STRUCT_OPS      dctcp_nouse     4       256     1
0x9b7bc3c43400  12      STRUCT_OPS      dctcp   4       256     1
Unfortunately, the current implementation does not parse the contents of the map, so it cannot determine the name of the kernel structure being implemented and the mapping between its member functions and the BPF programs. As always, contributions are highly welcome :). In this case, we would find out that it implements tcp_congestion_ops
to load a new TCP congestion control algorithm on the fly.
There is a lot more to explore in this memory image, so feel free to have a closer look at the other processes. You might also want to check out the krie example in our documentation
to get an impression of a larger BPF application.
Testing
We tested the plugins on memory images acquired from virtual machines running on QEMU/KVM that were suspended for the duration of the acquisition process. To ensure the correctness of all plugin results, we have cross-checked them by debugging the guest kernel as well as comparing them with bpftool running on the guest.
Below is a list of the distributions and releases that we used for manual testing
Debian
- 12.2.0-14, Linux 6.1.0-13
Ubuntu
- 22.04.2, Linux 5.15.0-89-generic
- 20.04, Linux 5.4.0-26-generic
Custom
- Linux 6.0.12, various configurations
- Linux 6.2.12, various configurations
For each of these kernels, we tested at least all the plugins on an image taken during the execution of the libbpf-bootstrap example programs.
Additionally, to the above mentioned kernels we also developed an evaluation framework (the code is not public). The framework is based on Vagrant
and libvirt
/KVM
. First we create and update all VMs. After that we run programs from libbpf-bootstrap with nohup so that we can leave the VM and dump the memory from outside. To dump the memory we use virsh with virsh dump <name of VM> --memory-only. virsh dump pauses the VM for a clean acquisition of the main memory. We also install debug symbols for all the Linux distributions under investigation so that we can gather the debug kernels (vmlinux with DWARF debugging information) and the System.map file. We then use both files with dwarf2json
to generate the ISF information that Volatility 3 needs. Currently, we tested the following Linux distributions with their respective kernels:
- Alma Linux 9 - Linux kernel 5.14.0-362.8.1.el9_3.x86_64 ✅
- Fedora 38 - Linux kernel 6.6.6-100.fc38.x86_64 ✅
- Fedora 39 - Linux kernel 6.6.6-200.fc39.x86_64 ✅
- CentOS Stream 9 - Linux kernel 5.14.0-391.el9.x86_64 ✅
- Rocky Linux 8 - Linux kernel 4.18.0-513.9.1.el8_9.x86_64 ✅
- Rocky Linux 9 - 🪲
kernel-debuginfo-commonpackage is missing so the kernel debugging symbols cannot be installed (list of packages ) - Debian 11 - Linux kernel 5.10.0-26-amd64 ✅
- Debian 12 - Linux kernel 6.1.0-13-amd64 ✅
- Ubuntu 22.04 - Linux kernel 5.15.0-88-generic ✅
- Ubuntu 23.10 - Linux kernel 6.5.0-10-generic ✅ (works partially, but process listing is broken due to this dwarf2json GitHub Issue )
- ArchLinux - Linux kernel 6.6.7-arch1-1 ✅ (works partially, but breaks probably due to the same issue as volatility3/dwarf2json GitHub Issue )
- openSUSE Tumbleweed - ❓ it seems that the debug kernel that is provided by OpenSUSE does contain debugging symbols but other sections such as
.rodataare removed (zeroed out) so thatdwarf2jsonis not able to find the banner (further analyses cannot be carried out without this information) - we will further investigate this issue
We will check if the problems get resolved and re-evaluate our plugin. Generally, our framework is designed to support more distributions as well and we will try to evaluate the plugin on a wider variety of them.
During our automated analysis we encountered an interesting problem. To collect the kernels with debugging symbols from the VMs we need to copy them to the host. When copying the kernel executable file it will be read into main memory by the kernel’s page-cache mechanism. This implies that parts of the kernel file (vmlinux) and the kernel itself (the running kernel not the file) may be present in the dump. This can lead to the problem of the Volatility 3 function find_aslr (source code
) first finding matches in the page-cached kernel file (vmlinux) and not in the running kernel. An issue has been opened here
.
Related Work
There are several articles on BPF that cover different security-related aspects of the subsystem. In this section, we will briefly discuss the ones that are most relevant to the presented work.
Memory Forensics: The crash
utility, which is used to analyze live systems or kernel core dumps, has a bpf subcommand
that can be used to display information about BPF maps and programs. However, as it is not a forensics tool it relies solely on the information obtained via the prog_idr and map_ird. Similarly, the drgn
programmable debugger comes with a script
to list BPF programs and maps but suffers from the same problems when it comes to anti-forensic techniques. Furthermore, drgn and crash are primarily known as debugging tools for systems developers and as such not necessarily well-established in the digital forensics and incidence response (DFIR) community. In contrast, we implemented our analyses as plugins for the popular Volatility framework well-known in the DFIR community. Finally, A. Case and G. Richard presented Volatility plugins for investigating the Linux tracing infrastructure in their BlackHat US 2021 paper
. Apart from a plugin that lists programs by parsing the prog_idr, they have also implemented several plugins that can find BPF programs by analyzing the data structures of the attachment mechanisms they use, such as kprobes, tracepoints or perf events. Thus, their plugins are also able to discover inconsistencies that could reveal anti-forensic tampering. However, they have never publicly released their plugins and despite several attempts we have been unable to contact the authors to obtain a copy of the source code. Volatility already supports detecting BPF programs attached to sockets in its sockstat
plugin. The displayed information is limited to names and IDs.
Reverse Engineering: Reverse engineering BPF programs is a key step while triaging the findings of our plugins. Recently, the Ghidra
software reverse engineering (SRE) suite gained support for the BPF architecture
, which means that its powerful decompiler can be used to analyze BPF bytecode extracted from kernel memory or user-space programs. Furthermore, BPF bytecode is oftentimes embedded into user-space programs that use framework libraries to load it into the kernel at runtime. For programs written in the Go programming language, ebpfkit-monitor
can parse the binary format of these embedded files to list the defined programs and maps as well as their interactions. It uses this information to generate graphs that are similar to those of our bpf_graph plugin. Although the utility of these graphs has inspired our plugin, it is fundamentally different in that it displays information about the state of the kernel’s BPF subsystem extracted from a memory image. Consequently, it is inherently agnostic to the user-space framework that was used for compiling and loading the programs. Additionally, it displays the actual state of the BPF subsystem instead of the BPF objects that might be created by an executable at runtime.
Runtime Protection and Monitoring: Important aspects of countering BPF malware are preventing attackers from loading malicious BPF programs and logging suspicious events for later review. krie and ebpfkit-monitor are tools that can be used to log BPF-related events as well as to deny processes access to the BPF system call.
Simply blocking access on a per-process basis is too course-grained for many applications and thus multiple approaches were proposed to implement a more fine-grained access control model for the BPF subsystem to facilitate the realization of least privilege policies. Among those, one can further distinguish between proposals that implement access control in user space, kernel space, or a hypervisor.
bpfman
(formerly known as bpfd) is a privileged user space daemon that acts as proxy for loading BPF programs and can be used to implement different access control policies. A combination of a privileged user-space daemon and kernel changes is used in the proposed BPF token approach
that allows delegation of access to specific parts of the BPF subsystem to container processes by a privileged daemon.
A fine-grained in-kernel access control is offered by the CapBits
proposed by Yi He et al. Here, two bitfields are added to the task_struct, where one defines the access that a process has to the BPF subsystem, e.g., allowed program types and helpers, and the other restricts the access that BPF programs can have on the process, e.g., to prevent it from being traced by kprobe programs. Namespaces are already used in many areas of the Linux kernel to virtualize global resources like PIDs or network devices. Thus, Y. Shao proposed introducing BPF namespaces
to limit the scope of loaded programs to processes inside of the namespace. Finally, signatures over programs
are a mechanism that allows the kernel to verify their provenance, which can be used analogous to module signatures that prevent attackers from loading malicious kernel modules.
Lastly, Y. Wang et al. proposed moving large parts of the BPF VM from the kernel into a hypervisor, where they implement a multi-step verification process that includes enforcing a security policy, checking signatures, and scanning for known malicious programs. In the security policy, allowed programs can be specified as a set of deterministic finite automata, which allows for accepting dynamically generated programs without allowing for arbitrary code to be loaded.
All these approaches are complementary to our plugins as they focus on reducing the chance that an attacker can successfully load a malicious program, while we assume that this step has already happened and aim to detect their presence.
Conclusion
In this post, we gave an introduction to the Linux BPF subsystem and discussed its potential for abuse. We then presented seven Volatility plugins that allow investigators to detect BPF malware in memory images and evaluated them on multiple versions of popular Linux distributions. To conclude the post, we will briefly discuss related projects we are working on and plans for future work.
This project grew out of the preparation of a workshop on BPF rootkits at the DFRWS EU 2023 annual conference (materials ). We began working on this topic because we believe that the forensic community needs to expand its toolbox in response to the rise of BPF in the Linux world to fill blind spots in existing analysis methods. Additionally, investigators who may encounter BPF in their work should be made aware of the potential relevance of the subsystem to their investigation.
While the workshop, our plugins, and this post are an important step towards this goal, much work remains to be done. First, in order for the present work to be useful in the real world our next goal must be to upstream most of it into the Volatility 3 project. Only this will ensure that investigators all around the world will be able to easily find and use it. This will require:
- Refactoring of our utility code to use Volatility 3’s extension class mechanism
- The
bpf_graphplugin relies on networkx , which is not yet a dependency of Volatility 3. If the introduction of a new dependency into the upstream project is not feasible, one could make it optional by checking for the presence of the package within the plugin. - Additional testing on older kernel versions and kernels with diverse configurations to meet Volatility’s high standards regarding compatibility
We will be happy to work with upstream developers to make the integration happen.
Furthermore, there remains the problem of dealing with the wide variety of map types when extracting their contents, as well as the related problem of pretty-printing them using BTF information. Here, we consider a manual implementation approach to be impractical and would explore the possibility of using emulation of the relevant functions.
Regarding the advanced analysis aimed at countering anti-forensics, we have also implemented consistency checks against the lists of kprobes and tracepoints, but these require further work to be ready for publication. We also described additional analyses in our workshop that still need to be implemented.
Finally, an interesting side effect of the introduction of BPF into the Linux kernel is that most of the functionality requires BTF information for the kernel and modules to be available. This provides an easy solution to the problem of obtaining type information from a raw memory image, a step that is central to automatic profile generation. We have already shown that it is possible to reliably extract BTF sections from memory images by implementing a plugin for that. We have also explored the possibility of combining this with existing approaches for extracting symbol information in order to obtain working profiles from a dump. While the results are promising, further work is needed to have a usable solution.
Appendix
A: Kernel Configuration
This section provides a list of compile-time kernel configuration options that can be adjusted to restrict the capabilities of BPF programs. In general, it is recommended to disable unused features in order to reduce the attack surface of a system.
BPF_SYSCALL=n: Disables the BPF system call. Probably breaks most systemd-based systems.DEBUG_INFO_BTF=n: Disables generation of BTF debug information, i.e., CORE no longer works on this system. Forces attackers to compile on/for the system they want to compromise.BPF_LSM=n: BPF programs cannot be attached to LSM hooks.LOCK_DOWN_KERNEL_FORCE_INTEGRITY=y: Prohibits the use ofbpf_probe_write_user.NET_CLS_BPF=nandNET_ACT_BPF=n: BPF programs cannot be used in TC classifier actions. Stops some data exfiltration techniques.FUNCTION_ERROR_INJECTION=n: Disables the function error injection framework, i.e., BPF programs can no longer usebpf_override_return.NETFILTER_XT_MATCH_BPF=n: Disables option to use BPF programs in nftables rules . Could be used to implement malicious firewall rules.BPF_EVENTS=n: Removes the option to attach BPF programs to kprobes, uprobes, and tracepoints.
Below are options that limit features that we consider less likely to be used by malware.
BPFILTER=n: This is an unfinished BPF-based replacement of iptables/nftables (currently not functional).LWTUNNEL_BPF=n: Disables the use of BPF programs for routing decisions in light weight tunnels.CGROUP_BPF=n: Disables the option to attach BPF programs to cgoups. Cgroup programs can monitor various networking-related events of processes in the group. Probably breaks most systemd-based systems.