Android Binary Exploitation
In this post, we will examine security mechanisms that Android 12 employs in order to make binary exploitation a bit harder. Also, we will discuss how to get to certain information like shared - object files that are necessary for successful exploitation. The latter will be generalized to getting limited source code access to an app given a corresponding .apk file.
Environment
Before diving into details, the technical setup has to be clarified. All of the following observations on security mechanisms were encountered on a x86_64 Pixel 3 emulator running Android 12 (build number is SE1A.220203.002.A1
). When referencing source code from Android Open Source Project (AOSP), it will be w.r.t. Android 12.0.0_r31
. The build variant for damnvulnerableapp is currently only debug. Also there is no GooglePlay enabled as we require root on the device for debugging purposes only.
In addition to that, standard compilation configurations of Android Studio are used to construct the app and compile native code. The version of Android Studio is as follows:
- Android Studio Dolphin | 2021.3.1
- Build #AI-213.7172.25.2113.9014738, built on August 31, 2022
- Runtime version: 11.0.13+0-b1751.21-8125866 amd64
- VM: OpenJDK 64-Bit Server VM by JetBrains s.r.o.
- Linux 5.15.0-46-generic
- GC: G1 Young Generation, G1 Old Generation
- Memory: 2048M
- Cores: 12
- Registry:
- external.system.auto.import.disabled=true
- debugger.watches.in.variables=false
- ide.text.editor.with.preview.show.floating.toolbar=false
- Current Desktop: ubuntu:GNOME
If your environment differs even in the slightest way, you might need different offsets, addresses etc. to get your exploits to work. Thus, if I presents exploit sketches, do not assume that they work out of the box!
Overview of Security Mechanisms on Android
Next, via a non - exhaustive list of security mechanisms we will dive into the details of how Android makes life of an attacker (a bit) harder. If possible, we will try to figure out a way to bypass each security mechanism through additional assumptions.
Permissions
As usual, an app has certain permissions to access specific data or perform specific actions. E.g. in order to create a connection to a remote host via java.net.Socket
, an app has to declare the install - time permission android.permission.INTERNET
in its manifest. If a permission is not declared (install - time) or not granted (runtime), then the app will not be able to provide the functionality that needs the respective permission(s).
Continuing the example above, if we somehow manage to get abitrary code execution inside of an Android app, but the app does not declare android.permission.INTERNET, then we will not be able to create a socket connection to call back to our netcat - listener for a reverse shell.
Permissions can further be divided into
- Install - time permissions
: System automatically grants these upon installation. These permissions can be further classified into
- Normal permissions : Allow for access to data and actions beyond the app’s sandbox.
- Signature permissions : Irrelevant for now!
- Runtime permissions : User will be shown a permission prompt that specifically asks for a potentially dangerous permission. These prompts will be presented only if the app is running/starting.
- Special permissions : Irrelevant for now! We assume an app that is not even capable of specifying these permissions.
Assuming source code access and thus access to AndroidManifest.xml, we can deduce which actions are allowed in our shellcode. Another (naive) assumption is to believe that an app is incapable of adding additional permissions without a user’s consent via publicly known means (otherwise this would be a severe security issue). Of couse, our shellcode could try to present the user permission prompts that give us further tools to play with, but this is far from stealthy!
Summarizing, a shellcode is limited to the app’s permissions. Theoretically it is possible for shellcode to request runtime permissions … at runtime. It would be interesting to see whether it is possible to request install - time permissions at runtime.
FORTIFY
This mechanism adds additional compile - time and/or runtime checks to the C standard library. These are mainly memory - related checks, e.g.
struct Foo {
    int val;
    struct Foo *next;
};
void initFoo(struct Foo *f) {
    memset(&f, 0, sizeof(struct Foo));
}
will not work, because FORTIFY is able to detect the 8 - byte overflow at compile - time (example taken from here ).
At compile - time, FORTIFY will block compilation, if it is able to detect a bad call to a standard library function like e.g. memset. If FORTIFY is missing information or is very certain that a call is safe, then FORTIFY will be not be part of the process image. Finally, if there is a call, but FORTIFY is not sure whether the call is safe or not, it will redirect the call to a special FORTIFY’ed version of the called function, which applies additional checks to ensure correct usage of the function.
Lets consider an Android - related example of the function memset
:
__BIONIC_FORTIFY_INLINE
void* memset(void* const s __pass_object_size0, int c, size_t n) __overloadable
        /* If you're a user who wants this warning to go away: use `(&memset)(foo, bar, baz)`. */
        __clang_warning_if(c && !n, "'memset' will set 0 bytes; maybe the arguments got flipped?") {
#if __ANDROID_API__ >= 17 && __BIONIC_FORTIFY_RUNTIME_CHECKS_ENABLED
    return __builtin___memset_chk(s, c, n, __bos0(s));
#else
    return __builtin_memset(s, c, n);
#endif
}
As these are builtins, they are implemented by the compiler and thus pretty hard to track down (if you are interested, consider code that looks like a compile - time check and a runtime - check ; no guarantees that these references are what is actually being called!).
Sooo…how to break it? Apparently, if FORTIFY is lacking information, it will just give up. The developers gave a pretty nice example for FORTIFY’s limitations:
__attribute__((noinline)) // Tell the compiler to never inline this function.
inline void intToStr(int i, char *asStr) { sprintf(asStr, "%d", i); }

char *intToDupedStr(int i) {
    const int MAX_INT_STR_SIZE = sizeof("2147483648"); // MAX_INT_STR_SIZE = 11 = 10 + 1
    char buf[MAX_INT_STR_SIZE];
    intToStr(i, buf);
    return strdup(buf);
}
Setting i = -2147483648 (which is 0x80000000, because of 2’s - complement for 4 - byte values) would result in an off - by - one bug, because buf is a buffer of 11 elements, the last of which is supposed to be a null - terminator. Because sprintf will also put a - sign into buf, the null - terminator will be moved back by one and therefore overwrite the least - significant byte of the next qword on the stack. If rbp was modified, then this would most likely crash the entire program. FORTIFY does not catch this bug, because from the perspective of intToStr, FORTIFY cannot “see” the allocation of buf. Neither can FORTIFY determine for sure the size of a char*, which could be of arbitrary length, nor can it determine where buf is pointing to (stack, heap, .bss, .data, …).
Observe that FORTIFY makes it significantly harder for developers to write vulnerable code. Still, if developers decide to implement their own versions of e.g. memcpy this fully bypasses FORTIFY. Also, as can be seen in the above example, there are settings, in which FORTIFY cannot help, i.e. e.g. if the allocation of a buffer takes place in a different function and this buffer is passed as a type*.
On defeating PIEs
When building native apps on Android via Android Studio, we will almost always use cmake’s add_library
with the SHARED flag. This will encapsulate the native code into a lib<somename>.so
file, which is actually a shared - object file (ELF
). According to documentation
, for such SHARED libraries the property POSITION_INDEPENDENT_CODE is automatically set to ON, thus resulting in Position - Independent - Executables (PIEs; To be precise with terminology, the shared - object file contains Position - Independent - Code (PIC). From ELF’s perspective, not every shared - object file is an executable and vice versa).
When calling System.loadLibrary("xyz"), we can trace down the call hierarchy to versions of dlopen
, which is implemented in the linker
. Finally, ReserveWithAlignmentPadding
will be called, which returns a randomized base address
. This confirms that when loading native shared - object files, they will have ASLR
enabled by default.
Defeating ASLR is thus key to handling binary exploitation in PIEs. This can be archieved in numerous ways. The following is a non - exhaustive list of possible ways to break ASLR:
- Leaking an address from e.g. a code region. It seems that the random shift used for the stack (and heap etc.) and a loaded shared - object file differ. This follows from the randomized base address
, which is different on each execution of
ReserveWithAlignmentPadding. - Abusing a side channel that allows for brute - forcing / leaking bytes of an address one by one instead of being forced into brute - forcing / leaking the entire address at once.
- From
ReserveWithAlignmentPadding, by probing for accessible memory mappings. Depending on the app, we might be able to even distinguish different kinds of errors / signals when accessing / returning to invalid memory. However, for memory probing to work the process should not crash upon signals likeSIGSEGorSIGILL, which is very rare.
Full RELRO
With the above security mechanisms in place, it would still be “easy” to abuse a leak combined with a Write - What - Where condition, as e.g. .got is still writable. E.g. overwriting a .got entry of strlen that is given a string of our choice could result in a redirection to system (for a more detailed discussion, see this blog post
). This is, among other things, prevented by full / partial Relocations Read - Only, i.e. full / partial RELRO, which can be enabled
on Android. Full RELRO marks certain memory regions, like e.g. .got, as read - only after program startup. It seems that it is enabled by default, when creating a new native android app in Android Studio.
Now the question arises, how this mitigation can be circumvented. This again depends on the app. Lets consider the non - exhaustive list:
- Given a Write - What - Where condition and knowledge on all addresses:
- Try to find and overwrite a global variable (located in
.bssor.data) that impacts the control flow, e.g. a function pointer. - Overwrite the return address on the stack to return to a ROP - chain located “somewhere else”.
- Try to find and overwrite a global variable (located in
- Given access to
mprotect:- Call
mprotecton.gotto make it writable again.
- Call
Non - executable Stack (and Heap)
As has been the case for decades, the stack and heap is marked as non - executable by default. Thus, calling your classical NOP - sledge for help won’t do any good.
(Un-)fortunately, the stack and heap can be used to store gadgets for a ROP - chain.
Canaries and cookies
Depending on how a native function is implemented and compiled, it can be given a stack canary. This canary aims to protect the stack frame, i.e. the return address and stored rbp, from potential buffer overflows on the stack. In our case, this canary is an 8 - byte random value that is very hard to predict. Doing the math reveals that we have a 1/(2^64) chance to hit the correct canary. This is why we often assume that there is some kind of leak that (partially) reveals the canary (bytes). Naturally, two approaches come to mind when thinking of “leaking an 8 byte random value”:
Reading it directly from the stack. Trivially, this will reveal the value.
Brute - forcing it via a side channel. The side channel could be e.g. an oracle that either says
- “Canary is correct”, i.e. process keeps running
- “Canary is incorrect”, i.e. process crashes.
If we overwrite just the least - significant byte of the canary, this byte will be in either of the above categories. If the process does not crash, we can continue with the next canary byte until all 8 bytes are leaked.
So, why would the latter approach work? The canary will be consisting of 8 random bytes for each process start, right? Right? No! Not going into the details
, the underlying syscall fork, which is used to spawn damnvulnerableapp and its subprocess that is running the vulnerable module, will be called from the same parent process (zygote) over and over again, i.e. for each app. Therefore, apps contain large duplicated memory regions, canary included.
Getting the source
And now for something completely different. Well, technically speaking it is not that different, because packing the source code could be considered a form of obfuscation, which again could be considered a security precaution. Now we will take the perspective of an attacker that tries to get access to the source code of an app while only having access to an app’s apk file.
Finding the apk file
There are numerous ways to get an apk file of an app, among which the following seem to be the easiest ones:
- Use Android Studio to build the app and search for the
apkfile in the directory tree of the app. This implies source code access and therefore makes analyzing anapkfile obsolete, but it is a way. - Assuming root access on an Android device / emulator, user - installed apps can be found at e.g.
/data/app/. There can be a corresponding.apkfile to grab for further static analysis (this might depend on the Android version).
Unpacking apk files
Assuming we grabbed ourselves an apk file, we can start analyzing it:
$ file base.apk
base.apk: Zip archive data, at least v?[0] to extract
$ unzip base.apk -d ./base
...
$ ls base
AndroidManifest.xml  classes10.dex  classes11.dex  classes2.dex  classes3.dex  classes4.dex  classes5.dex  classes6.dex  classes7.dex  classes8.dex  classes9.dex  classes.dex  lib  META-INF  res  resources.arsc
Going from here we can easily access the native libraries that are part of the app:
$ ls base/lib/x86_64
libDoubleFreeModule.so  libEasyStackBufferOverflowModule.so  libHeapOverflowModule.so  libOffByOneModule.so  libStackBufferOverflowModule.so  libUseAfterFreeExecModule.so  libUseAfterFreeWriteModule.so
These shared - object files can later be used for finding gadgets and so on. Further they can be analyzed / decompiled via e.g. Ghidra
. The decompiled code of logMessage#libOffByOneModule.so could look like this:
undefined8
Java_com_damnvulnerableapp_vulnerable_modules_OffByOneModule_logMessage
		(long *param_1,undefined8 param_2,undefined8 param_3)

{
	int iVar1;
	undefined4 uVar2;
	undefined8 uVar3;
	void *pvVar4;
	undefined8 uVar5;
	long in_FS_OFFSET;
	int local_cc;
	undefined8 local_a0;
	timespec local_28;
	undefined local_11;
	long local_10;

	local_10 = *(long *)(in_FS_OFFSET + 0x28);
	uVar3 = (**(code **)(*param_1 + 0x5c0))(param_1,param_3,&local_11);
	DAT_00103028 = DAT_00103028 + 1;
	DAT_00103020 = realloc(DAT_00103020,DAT_00103028 * 0x108);
	if (DAT_00103020 == (void *)0x0) {
		local_a0 = 0;
	}
	else {
		pvVar4 = (void *)((long)DAT_00103020 + (DAT_00103028 + -1) * 0x108);
		__memset_chk(pvVar4,0,0x108,0xffffffffffffffff);
		__memcpy_chk((long)pvVar4 + 0x100,&PTR_FUN_00103010,8,0xffffffffffffffff);
		local_cc = (**(code **)(*param_1 + 0x558))(param_1,param_3);
		if (0x100 < local_cc + -1) {
			local_cc = 0xff;
		}
		__memcpy_chk(pvVar4,uVar3,(long)local_cc,0xffffffffffffffff);
		iVar1 = clock_gettime(0,&local_28);
		if (iVar1 != -1) {
			local_28.tv_nsec = local_28.tv_nsec + 10;
		}
		uVar5 = (**(code **)((long)pvVar4 + 0x100))(pvVar4,(long)local_cc);
		uVar2 = __strlen_chk(uVar5,0xffffffffffffffff);
		local_a0 = (**(code **)(*param_1 + 0x580))(param_1,uVar2);
		(**(code **)(*param_1 + 0x680))(param_1,local_a0,0,uVar2,uVar5);
		(**(code **)(*param_1 + 0x600))(param_1,param_3,uVar3,2);
	}
	if (*(long *)(in_FS_OFFSET + 0x28) == local_10) {
		return local_a0;
	}
				/* WARNING: Subroutine does not return */
	__stack_chk_fail();
}
In order to not being forced into manually setting up the jni type definitions, see either jni_all.h
or jni_all.h
. When in the CodeBrowser, try running File -> Parse C Source…, add the corresponding file to “Source files to parse”, choose the correct base profile (“parse configuration”) and set the parse options to e.g. this
.
To be more precise, first download any of the above mentioned jni_all.h files. Then open File -> Parse C Source…. You should be prompted with the following window:
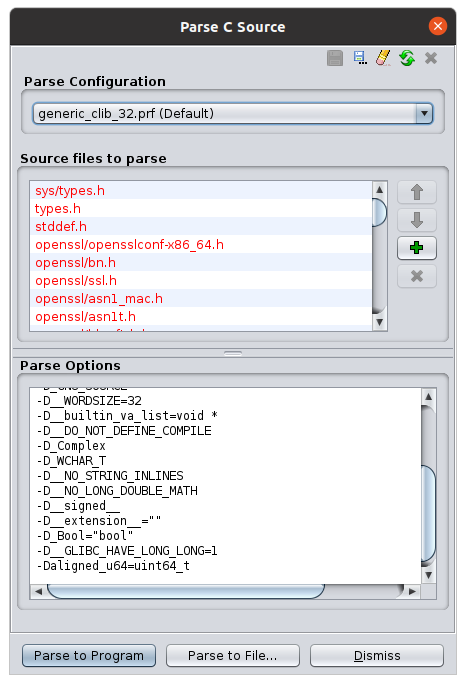
Next, choose an existing profile as a base profile. E.g. choose generic_clib_32.prf and click on the Save profile to new name button (upper right corner). Then choose a name that you recognize:
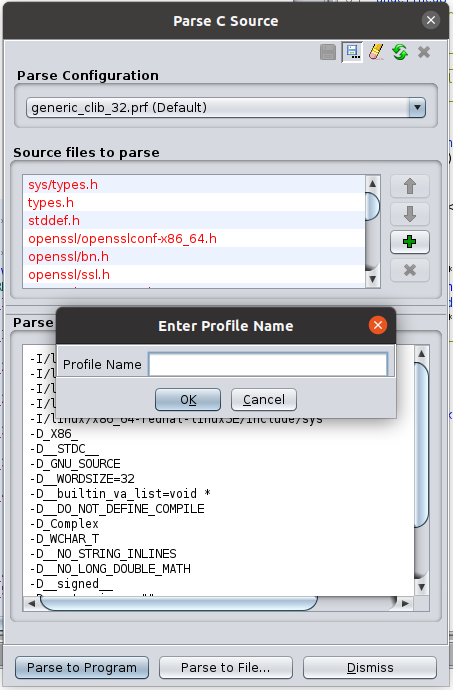
After giving the new profile a nice name, we need to adjust the parse options. E.g. you can copy them over from here . Do not overwrite -I options:
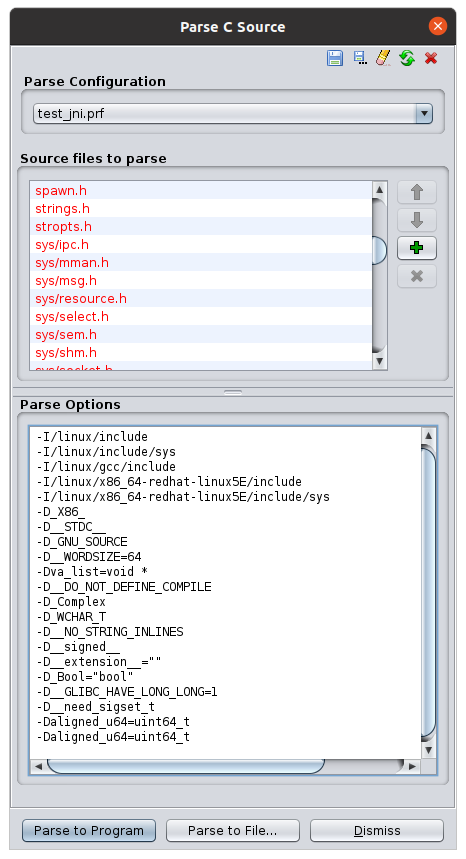
Finally, add jni_all.h to the Source files to parse panel by clicking on the green plus sign to the right. This should open files. Navigate to jni_all.h and open it. You should see a new entry if you scrolled all the way down. Now click the Save profile button at the top and then Parse to program at the bottom. If you now retype a variable, e.g. the first argument of a JNI function to JNIEnv*, you will see actual function names like NewByteArray etc.
Now we are just missing the Java code that calls this native function…
Getting Java code
In order to obtain the Java code of an app, an attacker could utilize a tool like jadx . This basically reconstructs the project structure we see in Android Studio:
$ jadx-gui ./base.apk
...
This decompiles a large portion of the app. Continuing the example of the OffByOneModule, we can get the following decompiled code for the OffByOneModule class:
package com.damnvulnerableapp.vulnerable.modules;

import com.damnvulnerableapp.common.exceptions.VulnerableModuleException;

/* loaded from: classes10.dex */
public class OffByOneModule extends VulnerableModule {
    private static native byte[] logMessage(byte[] bArr);

    static {
        System.loadLibrary("OffByOneModule");
    }

    public OffByOneModule() {
        super(new OffByOneModuleConfiguration());
    }

    @Override // com.damnvulnerableapp.vulnerable.modules.VulnerableModule
    public void main() throws VulnerableModuleException {
        output("Welcome to the most secure message logger in the world!".getBytes());
        while (true) {
            output("Enter a message to log: ".getBytes());
            byte[] message = input();
            if (message == null) {
                output("Failed to receive the message to log...Better safe than sorry!".getBytes());
            } else if (new String(message).equals("EXIT")) {
                output("Your logged message(s) were stored successfully.".getBytes());
                return;
            } else {
                output(logMessage(message));
            }
        }
    }
}
Grabbing System Libraries
Often there are libraries, of which we have a leaked pointer. Having such a pointer is nice and all, but it will not help, if we do not have access to the corresponding shared - object file. Lets try to get access to libart.so, the android runtime that runs the Java code we wrote for the app. Among other things, it handles native calls via trampoline functions like art_quick_generic_jni_trampoline
.
In order to find libart.so, again assuming root access, running the damnvulnerableapp reveals the binary that underlies the process:
# ps -e | grep damn
u0_a107       4122   357 13798620 114268 do_epoll_wait      0 S com.damnvulnerableapp
# file /proc/4122/exe
/proc/4122/exe: symbolic link to /system/bin/app_process64
# readelf -d /system/bin/app_process64
...
 0x0000000000000001 (NEEDED)             Shared library: [libandroid_runtime.so]
 0x0000000000000001 (NEEDED)             Shared library: [libbinder.so]
 0x0000000000000001 (NEEDED)             Shared library: [libcutils.so]
 0x0000000000000001 (NEEDED)             Shared library: [libhidlbase.so]
 0x0000000000000001 (NEEDED)             Shared library: [liblog.so]
 0x0000000000000001 (NEEDED)             Shared library: [libnativeloader.so]
 0x0000000000000001 (NEEDED)             Shared library: [libsigchain.so]
 0x0000000000000001 (NEEDED)             Shared library: [libutils.so]
 0x0000000000000001 (NEEDED)             Shared library: [libwilhelm.so]
 0x0000000000000001 (NEEDED)             Shared library: [libc++.so]
 0x0000000000000001 (NEEDED)             Shared library: [libc.so]
 0x0000000000000001 (NEEDED)             Shared library: [libm.so]
 0x0000000000000001 (NEEDED)             Shared library: [libdl.so]
...
This means that libart.so will be loaded later on, i.e. not at startup. Further analysis reveals:
# cat /proc/4122/maps | grep libart.so
730c03400000-730c0357b000 r--p 00000000 fe:0f 57                         /apex/com.android.art/lib64/libart.so
730c0377a000-730c03e0b000 r-xp 0017a000 fe:0f 57                         /apex/com.android.art/lib64/libart.so
730c0400a000-730c0401d000 r--p 0080a000 fe:0f 57                         /apex/com.android.art/lib64/libart.so
730c0421c000-730c04220000 rw-p 0081c000 fe:0f 57                         /apex/com.android.art/lib64/libart.so
# exit
$ adb pull /apex/com.android.art/lib64/libart.so ./libart.so
After the above commands, libart.so should be in our current working directory, ready to be analyzed via Ghidra, objdump
(which will most likely not work, because objdump does not recognize the architecture) or readelf
.
There may be two unexpected aspects:
- Even if you do not have root access on the emulator, it is possible to run
adb pull <from remote> <to local>. We only used root to access/proc/4122/mapsetc. - The name of the binary that underlies damnvulnerableapp is
/system/bin/app_process64. To that end, observe that Java apps are forked from the zygote process . The zygote process, among other things, initializes the JVM to allow for faster app starts.
Analysing the Stack Trace
There is one more thing to consider. When given a leak, e.g. an address from the stack, then it is important to (partially) understand what values are located on the stack. To that end, one may write a small native app via Android Studio, set a breakpoint on the native function and run the app. This could result in the following stack trace:
Java_com_damnvulnerableapp_vulnerable_modules_EasyStackBufferOverflowModule_vulnerableToUpper EasyStackBufferOverflowModule.c:32
art_quick_generic_jni_trampoline 0x000071636dba032c
art_quick_invoke_stub 0x000071636db95015
art::ArtMethod::Invoke(art::Thread *, unsigned int *, unsigned int, art::JValue *, const char *) 0x000071636dc1d9fb
art::interpreter::ArtInterpreterToCompiledCodeBridge(art::Thread *, art::ArtMethod *, art::ShadowFrame *, unsigned short, art::JValue *) 0x000071636dda335d
art::interpreter::DoCall<…>(art::ArtMethod *, art::Thread *, art::ShadowFrame &, const art::Instruction *, unsigned short, art::JValue *) 0x000071636dd9d16d
art::interpreter::ExecuteSwitchImplCpp<…>(art::interpreter::SwitchImplContext *) 0x000071636dbac1d0
ExecuteSwitchImplAsm 0x000071636dba23d6
art::interpreter::ExecuteSwitch(art::Thread *, const art::CodeItemDataAccessor &, art::ShadowFrame &, art::JValue, bool) 0x000071636dd9ca6e
art::interpreter::Execute(art::Thread *, const art::CodeItemDataAccessor &, art::ShadowFrame &, art::JValue, bool, bool) 0x000071636dd94ae1
art::interpreter::ArtInterpreterToInterpreterBridge(art::Thread *, const art::CodeItemDataAccessor &, art::ShadowFrame *, art::JValue *) 0x000071636dd9c55c
art::interpreter::DoCall<…>(art::ArtMethod *, art::Thread *, art::ShadowFrame &, const art::Instruction *, unsigned short, art::JValue *) 0x000071636dd9d14e
MterpInvokeVirtual 0x000071636e16e306
mterp_op_invoke_virtual 0x000071636db7e71a
art::interpreter::Execute(art::Thread *, const art::CodeItemDataAccessor &, art::ShadowFrame &, art::JValue, bool, bool) 0x000071636dd94b43
art::interpreter::ArtInterpreterToInterpreterBridge(art::Thread *, const art::CodeItemDataAccessor &, art::ShadowFrame *, art::JValue *) 0x000071636dd9c55c
art::interpreter::DoCall<…>(art::ArtMethod *, art::Thread *, art::ShadowFrame &, const art::Instruction *, unsigned short, art::JValue *) 0x000071636dd9d14e
MterpInvokeInterface 0x000071636e175bfd
mterp_op_invoke_interface 0x000071636db7e91a
art::interpreter::Execute(art::Thread *, const art::CodeItemDataAccessor &, art::ShadowFrame &, art::JValue, bool, bool) 0x000071636dd94b43
artQuickToInterpreterBridge 0x000071636e159a70
art_quick_to_interpreter_bridge 0x000071636dba04bd
<unknown> 0x000071636dba07c0
This is a stack - trace of a module that will be exploited in a later post. The most important address is the return address of Java_com_damnvulnerableapp_vulnerable_modules_EasyStackBufferOverflowModule_vulnerableToUpper, i.e the address into art_quick_generic_jni_trampoline: 0x000071636dba032c. Depending on whether the native method is e.g. declared as static or not, different stubs
are called, which may result in different return addresses. Thus it might be beneficial to produce a small sample app with the same setup as the target app, especially w.r.t. access modifiers etc. of the native method, to get an idea of the stack - trace.
Debugging on Android
Another very important aspect of binary exploitation is debugging. There are a lot of good resources out there (like 1 , 2 ). One possible debugger is GDB . As GDB by itself is pretty hard to use, I will use an extensions in this series, called GEF . A prerequisite is that we have root access on the device/emulator.
Starting an app from terminal
In order to debug an app, the app needs to run. In this case, as we are using a “special” app, we just need to run it without waiting for a debugger to attach. Running an app can be done as follows:
$ adb shell "am start -n com.damnvulnerableapp/com.damnvulnerableapp.managerservice.ManagerActivity"
Here we assume that the app of choice is the DamnVulnerableApp, which is the main focus of this series.
From here onwards, the manager will run in the background and wait for incoming connections. Once a connection is established, the messages will be used to tell the manager what to do, like spawning a vulnerable module.
Starting an exploit script
Assuming that connecting to a socket server is not a great challenge, right after the connection has been established and a vulnerable module selected, the exploit script should wait for the debugger to attach. This can be achieved like demonstrated in the following:
# Need tcp forward, i.e. 'adb forward tcp:8080 tcp:8080'
client = PwnClient('127.0.0.1', 8080)

client.select('EasyStackBufferOverflowModule')
print(client.fetch())

input('Press <enter> to continue...')
...
This is not the clean way, but it works just fine.
Attaching gdb
Notice that selecting a module should spawn a new process that encapsulates the vulnerable module. Now we need a gdbserver, which is part of the Android NDK
. Uploading the gdbserver to e.g. /data/local/tmp/gdbserver will enable us to attach to running processes. The command history could look like this:
$ adb push gdbserver /data/local/tmp/gdbserver
$ adb shell "chmod 777 /data/local/tmp/gdbserver"
$ adb forward tcp:1337 tcp:1337
$ adb shell "/data/local/tmp/gdbserver :1337 --attach $(pidof com.damnvulnerableapp:VulnerableActivity)"
...
Listening on port 1337
We will make gdb connect to port 1337 for debugging. After the last command, the process will block until a debugger connects. Before that, we should provide gdb with all necessary symbol information that is helpful for debugging. Namely (inspired from here
):
$ mkdir ~/dbgtmp
$ adb pull /system/lib64 ~/dbgtmp
$ mkdir ~/dbgtmp/tmp
$ adb pull /apex/com.android.art/lib64 ~/dbgtmp/tmp
$ mv ~/dbgtmp/tmp/* ~/dbgtmp/lib64
$ cp ~/path/to/unpacked/apk/lib/x86_64/* ~/dbgtmp/lib64
Then, in gdb/gef (taken from here and here ):
gef➤  set solib-absolute-prefix ~/dbgtmp/
gef➤  set solib-search-path ~/dbgtmp/lib64/
gef➤  gef-remote :1337
...
[+] Connected to ':1337'
[+] Remote information loaded to temporary path '/tmp/gef/6695'
gef➤  sharedlibrary
...
The last command will take ages to run, but its worth as we get access to almost all symbols we need (there is most likely a better way to do this). Basically we just need to do this once with all the libraries, then identify the libraries we are interested in and create a directory next to lib64 on our local machine that only contains this interesting subset of the shared - object files. This will speed up loading time by a lot!
Summary
We have seen some security mechanisms that will make the life of an attacker harder. Depending on the assumptions, like e.g. leaking an address, some mechanisms can be rendered useless. Also, we are now able to get limited source code access and debug Android apps using gdb. This will allow us to exploit the available modules in damnvulnerableapp.