Attempting Timing Attacks against Scudo
In this second blog post we will take a different approach for attacking Scudo
, i.e. we will try to the measure execution times for calls to malloc and hope to be able to derive a portion of the internal state of the allocator (i.e. perform side channel attacks). The version of Scudo considered in this blog post is 161cca266a9d0b6deb5f1fd2de8ad543649a7fa1
.
There will be almost only negative results (which means I unfortunately could not make it work), except for one. The main conclusion we can draw from this post is that Scudo is not designed to mitigate timing attacks! This follows from trying to leak a piece of information and then accidentally leaking a different and unclassified piece.
Disclaimer: The following analyses can be incomplete and/or incorrect. Also the experiments conducted are on a very basic level compared to the complex field of Data Science. The style of this post is informal and chosen based on the idea of practical attacks on Android.
Experimental Setup
As usual, there is a module for the damnvulnerableapp of the form:
JNIEXPORT jbyteArray JNICALL
Java_com_damnvulnerableapp_vulnerable_modules_HeapSCAModule_handleMessage(JNIEnv *env,
                                                                          jclass class,
                                                                          jbyteArray message) {

    uint32_t length = (*env)->GetArrayLength(env, message);
    if (length == 0)
        return NULL;

    jbyte *raw = (*env)->GetByteArrayElements(env, message, NULL);
    if (raw) {

        jbyteArray result = (*env)->NewByteArray(env, 8);
        switch (raw[0]) {
            case 0: {
                // Malloc
                uint64_t size = *((uint64_t*)&raw[1]);
                uint8_t *ptr;
                ptr = malloc(size);
                (*env)->SetByteArrayRegion(env, result, 0, 8, (jbyte*)&ptr);
                break;
            }
            case 1: {
                // Free
                uint8_t *ptr = (uint8_t*)(*(uint64_t*)&raw[1]);
                free(ptr);
                (*env)->SetByteArrayRegion(env, result, 0, 8, (jbyte*)&ptr);
                break;
            }
        }
        return result;
    }

    return NULL;
}
This module lets the user directly control whether and how to call malloc and free, or, to be more precise, Allocator::allocate
and Allocator::deallocate
. The input is composed like this: <func id><size | ptr> (9 bytes).
damnvulnerableapp is run in an x86-64 emulator (Pixel 3) running Android 12 and forwards remote user requests to the above module. It is already expected to see a lot of timing noise based on this setup.
Notice that measuring execution time of a remote call to e.g. malloc(0x10) (primary allocation) will actually measure execution time of a call to Java_com_damnvulnerableapp_vulnerable_modules_HeapSCAModule_handleMessage, which is called from Java.
As regards the client used to communicate with the app, it is written in C, thus it is expected to run faster than the former Python client. Because damnvulnerableapp uses a request - response model, i.e. a client has to request e.g. malloc(0x10), gets a response that the request “worked” and then has to fetch the result with a second request, the time measurements are conducted as follows:
struct timespec before;
struct timespec after;
...
// Request malloc(0x10)
app_forward(fd, (uint8_t*)message, 9, &buffer, &buffer_length, &before);

// Free response buffer
free(buffer);

// Request result of malloc(0x10)
app_fetch(fd, &buffer, &buffer_length, &after);

// Extract result from response
pointer = *(uint64_t*)get_content(buffer, buffer_length);

// Free response buffer
free(buffer);
...
app_fetch and app_forward (internally call app_send_formatted) are the core of this client:
enum error_code app_fetch(...)
{
    ...
    result = app_send_formatted(fd, "CONTENT", "FETCH", (uint8_t*)"", 0, NULL);
    if (result != error_success) {
        log_error("Failed to forward buffer");
        return result;
    }

    result = app_full_read(fd, buffer, buffer_size);
    if (result != error_success) {
        log_error("Failed to read response to forward");
        return result;
    }

    // Measure time after fetching result
    if (after_receive != NULL)
        clock_gettime(CLOCK_THREAD_CPUTIME_ID, after_receive);
    ...
}

enum error_code app_send_formatted(...)
{
    ...
    // Measure time before forwarding message
    if (before_send != NULL)
        clock_gettime(CLOCK_THREAD_CPUTIME_ID, before_send);

    result = app_full_write(fd, buffer, buffer_size + content_length);
    free(buffer);
    if (result != error_success) {
        log_error("Failed to send request");
        return result;
    }
    ...
}
Because of the request - response model, there is additional noise introduced by being forced to make two remote requests for one e.g. malloc(0x10)!
Lets again summarize expected sources of noise introduced by the experimental setup:
- Android OS is emulated and therefore does not behave like an Android OS running on a “real” device (e.g. in terms of CPU power and scheduling)
- Remote access to damnvulnerableapp. Although the emulator that runs the app is launched within the same device we will perform the measurements with, this is an additional layer of indirection.
- Call to e.g.
mallocis actually a call tohandleMessage, which has to be invoked from Java. The call stack is pretty deep… - Two requests per operation
Timing Attacks
In this section, timing attacks on different targets within Scudo will be discussed.
Attacking Chunks Array
The core idea is to abuse a timing side channel on Allocator::allocate, i.e. calling malloc in damnvulnerableapp. C->Count
will be the target of the attack, i.e. based on the measured execution times, we try to estimate the value of C->Count.
One may ask, why C->Count is interesting. There are two reasons:
- The chunk arrays are shuffled to, among other things, prevent an attacker from predicting where the next allocated chunk will be located. E.g. this can prevent heap overflows. Knowing
C->Countlooks like the first natural step to predicting how the array looks like in terms of address ordering. SizeClassAllocatorLocalCache::allocatecontains a classical pattern for a timing side channel:void *allocate(uptr ClassId) { ... PerClass *C = &PerClassArray[ClassId]; if (C->Count == 0) { // If C->Count = 0, then execution time is longer than "usual" ... refill(C, ClassId); ... } // The rest is very fast ... CompactPtrT CompactP = C->Chunks[--C->Count]; ... return Allocator->decompactPtr(ClassId, CompactP); }
When allocating memory from the primary allocator via e.g. malloc(0x10), then there is a number of allocations that will result in triggering C->Count == 0
, which again triggers execution of refill
. Afterwards, assuming that batches are only pushed back through drain
or are newly allocated via map
, we can distinguish the following cases for C->Count:
C->Count = C->MaxCount / 2. This stems from the fact thatdeallocatecan create batches if the correspondingChunksarray is full. To be precise, this will trigger the execution ofdrain, whereC->Count = C->MaxCount. Therefore the minimumCount = Min(C->MaxCount / 2, C->Count)indrainwill evaluate to0 < C->MaxCount / 2 < C->MaxCount. Finally,C->Count -= Count <=> C->Count = C->MaxCount - C->MaxCount / 2 = C->MaxCount / 2. Notice thatC->MaxCount = 2 * TransferBatch::getMaxCached(Size). As can be seen in the next step, formalloc(0x10), this will result inC->MaxCount = 2 * 13 = 26 => C->Count = 26 / 2 = 13.C->Count = MaxCount, i.e.:
C->Count = MaxCount
         = TransferBatch::getMaxCached(Size)
         = Min(MaxNumCached, SizeClassMap::getMaxCachedHint(Size))
         = Min(13, Max(1U, Min(Config::MaxNumCachedHint, N)))
         = Min(13, Max(1U, Min(13, (1U << Config::MaxBytesCachedLog) / static_cast<u32>(Size))))
         = Min(13, Max(1U, Min(13, (1U << 13) / Classes[ClassId - 1])))
where Classes
:
static constexpr u32 Classes[] = {
    0x00020, 0x00030, 0x00040, 0x00050, 0x00060, 0x00070, 0x00080, 0x00090,
    0x000a0, 0x000b0, 0x000c0, 0x000e0, 0x000f0, 0x00110, 0x00120, 0x00130,
    0x00150, 0x00160, 0x00170, 0x00190, 0x001d0, 0x00210, 0x00240, 0x002a0,
    0x00330, 0x00370, 0x003a0, 0x00400, 0x00430, 0x004a0, 0x00530, 0x00610,
    0x00730, 0x00840, 0x00910, 0x009c0, 0x00a60, 0x00b10, 0x00ca0, 0x00e00,
    0x00fb0, 0x01030, 0x01130, 0x011f0, 0x01490, 0x01650, 0x01930, 0x02010,
    0x02190, 0x02490, 0x02850, 0x02d50, 0x03010, 0x03210, 0x03c90, 0x04090,
    0x04510, 0x04810, 0x05c10, 0x06f10, 0x07310, 0x08010, 0x0c010, 0x10010,
};
So for a small allocation, i.e. for ClassId = 1, we get:
C->Count = Min(13, Max(1U, Min(13, 0x2000 / 0x20)))
         = Min(13, Max(1U, Min(13, 256)))
         = Min(13, Max(1U, 13))
         = 13
Notice that C->Count = MaxCount is true for all batches added to FreeList except for the last one, because N depends on a minimum:
for (u32 I = 0; I < NumberOfBlocks;) {
    TransferBatch *B =
        C->createBatch(ClassId, reinterpret_cast<void *>(decompactPtrInternal(
                                    CompactPtrBase, ShuffleArray[I])));
    if (UNLIKELY(!B))
        return nullptr;
    const u32 N = Min(MaxCount, NumberOfBlocks - I);    // If (NumberOfBlocks - I < MaxCount) => last iteration
    B->setFromArray(&ShuffleArray[I], N);
    Region->FreeList.push_back(B);
    I += N;
}
Single - Threaded Timing - Based Side Channel Attack on Primary
Assuming that the only thread that accesses the Scudo primary for allocations of the form malloc(0x10) can be convinced to run this allocation with a constant, computable overhead. Then, the following attack might enable the prediction of C->Count based on measures of elapsed time:
- In iteration
jperform 13 allocations (assuming classid 1 allocations, i.e.malloc(0x10)). For each allocation letx_{i,j}be the measured execution time (so0 <= i <= 12). - Add
x_{i,j}to the listX_i. - After
0 <= j < num_iterations13 - chunk allocations, compute the average over each list. Letx_i'be the average ofX_i - Let
k := argmax_{0<=i<=12} x_i' - Return
k
Consider the following visualization:
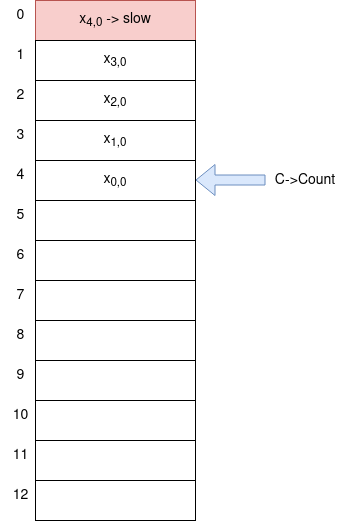
From the diagram we can see that C->Count = 4. Now, if we start measuring the execution times, i.e. we get x_{0,0} for C->Count = 4, x_{1,0} for C->Count = 3 etc. we can see that for C->Count = 0 x_{4,0} is the biggest value. Therefore, right after allocate returns, the result k = 4 of the above attack corresponds to the index of the biggest value x_{4,0}. Note that the second index is used to perform the 13 allocations multiple times in order to cancel out noise using the mean. Also, assuming that each call to malloc via handleMessage
is only triggering this very malloc, i.e. there is no other call to malloc that influences C->Count, after the attack C->Count takes the same value it had before performing the attack (because C->Count is in mod 13 and we run 13 * num_iterations allocations, which is divisible by 13).
Before the above attack, it may be beneficial to run a few allocations to ensure that populateFreeList
is called. This will result in 13
chunks being available in C->Chunks and thus C->Count = 13 right after refill
and C->Count = 12 right after allocate returns.
The main problem is that the assumptions are too strong for this attack to work on a real - world app. I.e. there are multiple threads that run malloc(0x10). Therefore, the timings measured from the perspective of a single thread may be influenced by the following:
- Thread synchronization in
Allocator::allocate. I.e. if there is another thread currently allocating memory via the primary, then our thread is forced to wait until the critical section is unlocked. - Between two calls to
malloc(0x10), there may be an arbitrary amount of threads that runmalloc(0x10)due to scheduling. Therefore, the above attack, which assumes to be able to run 13 consecutive allocations in a row, is unlikely to work. This basically poisons the averages, which makes all of them look almost the same! - Remote call to
malloccan trigger multiple allocations! Therefore, one measurement might decreaseC->Countby two or more instead of one.
Multithreaded Timing - Based Side Channel Attacks on Primary
This section describes different approaches that aim to predict C->Count based on measured timings in a multithreaded environment.
Learn Distribution from Leaked Counts
Let c_i for 0 <= i < n be the leaked values for C->Count from one thread (with fixed TSD) right before each malloc(0x10). Notice that due to multithreading, this leaked value might differ from the value that is used in the following malloc call. We assume that the probability for this is negligible though.
Then compute for 0 <= i < n-1 the difference of the C->Count values, i.e. d_i = -(c_{i+1} - c_{i}) mod 13. With high probability, the d_i represent the amount of malloc(0x10) calls performed by other threads between each pair of malloc(0x10) calls performed by our thread. Remember that the c_i are leaked from our main thread.
Construct the probability distribution according to the frequencies of the d_i values. It is expected to be binomially distributed. Then, apply those probabilities to the timings. I.e. between each consecutive pair of time measurements x_i and x_{i+1} there is a random variable D_i distributed according to the above distribution.
Assuming we have a sequence of values for C->Count that is unknown, then every element in this unknown sequence can be represented as a random variable. To be precise, letting C_i be the random variables representing the C->Count before the i-th malloc(0x10):
C_{i+1} = C_i + D_i = C_i + D // for all i: D_i are iid., so D~freq{d_i} is enough
Assuming that there is an anchor point, i.e. there exists a constant value 0 <= C_0 < 13 that is the first value for C->Count, then
C_{i+1} = C_i + D = (((C_0 + D) + D) + ... ) + D = C_0 + (i + 1) * D
=> E[C_{i+1}] = C_0 + (i+1) * E[D] = C_0 + (i+1) * (1/(n-1) * sum(d_i))
Given a sequence of timings x_i for 0 <= i < m measured by calling malloc(0x10), we could try to identify an anchor point, i.e. a point where refill was triggered by e.g. taking max(x_i). If we get x_k = max(x_i), then we performed k + 1 allocations in order to get to this maximum value. Therefore, we could try to compute E[C_k] to get the expected value for C->Count, which is based on the above formula.
Unfortunately, there are some problems with this approach:
- Does not take into account that other threads still run
malloc(0x10)in the background. Although this approach might work for computing the most probable value forC->Count, it would be invalidated the moment another thread calledmalloc(0x10). - Probabilistic approach…in practice, this will most likely not be that much better than just guessing the value, because there are only so few possible values
C->Countcan take.
Learn Thresholds
Another approach is to learn thresholds that distinguish a “refill - timing” from any other timing. Thus we will try to “learn” a threshold that allows for separating timings into either “refill” or “non - refill”. Although this approach might be too “simple”, because the problem can also be interpreted as distinguishing at least two guassian distributions, we can give it a try.
Initially, every thread is assigned to a TSD (linked to a cache, i.e. the Chunks array used in e.g. allocate
, which is based on the primary) in a round - robin fashion
. As experience showed that the app often has at least 20 threads, and NumberOfTSDs
is either DefaultTSDCount = 2
or getNumberOfCPUs
, which on the test system can at most be 8, we can conclude that there are multiple threads referencing the same TSD. This is still better than having all threads sharing a single TSD!
As the UAF module (see previous posts on Use - After - Free) suggests that the current TSD of the JNI thread “rarely” changes (due to exploitation of the UAF module working almost always), in the following we will assume that we use the same TSD. We will also assume that there either is no other thread that references the current TSD or is at least one such thread, but this thread does not allocate often from the primary with classid 1.
Performing only primary allocations of size 0x10, i.e. repeatedly calling a JNI function that calls malloc(0x10), results in the following plot:
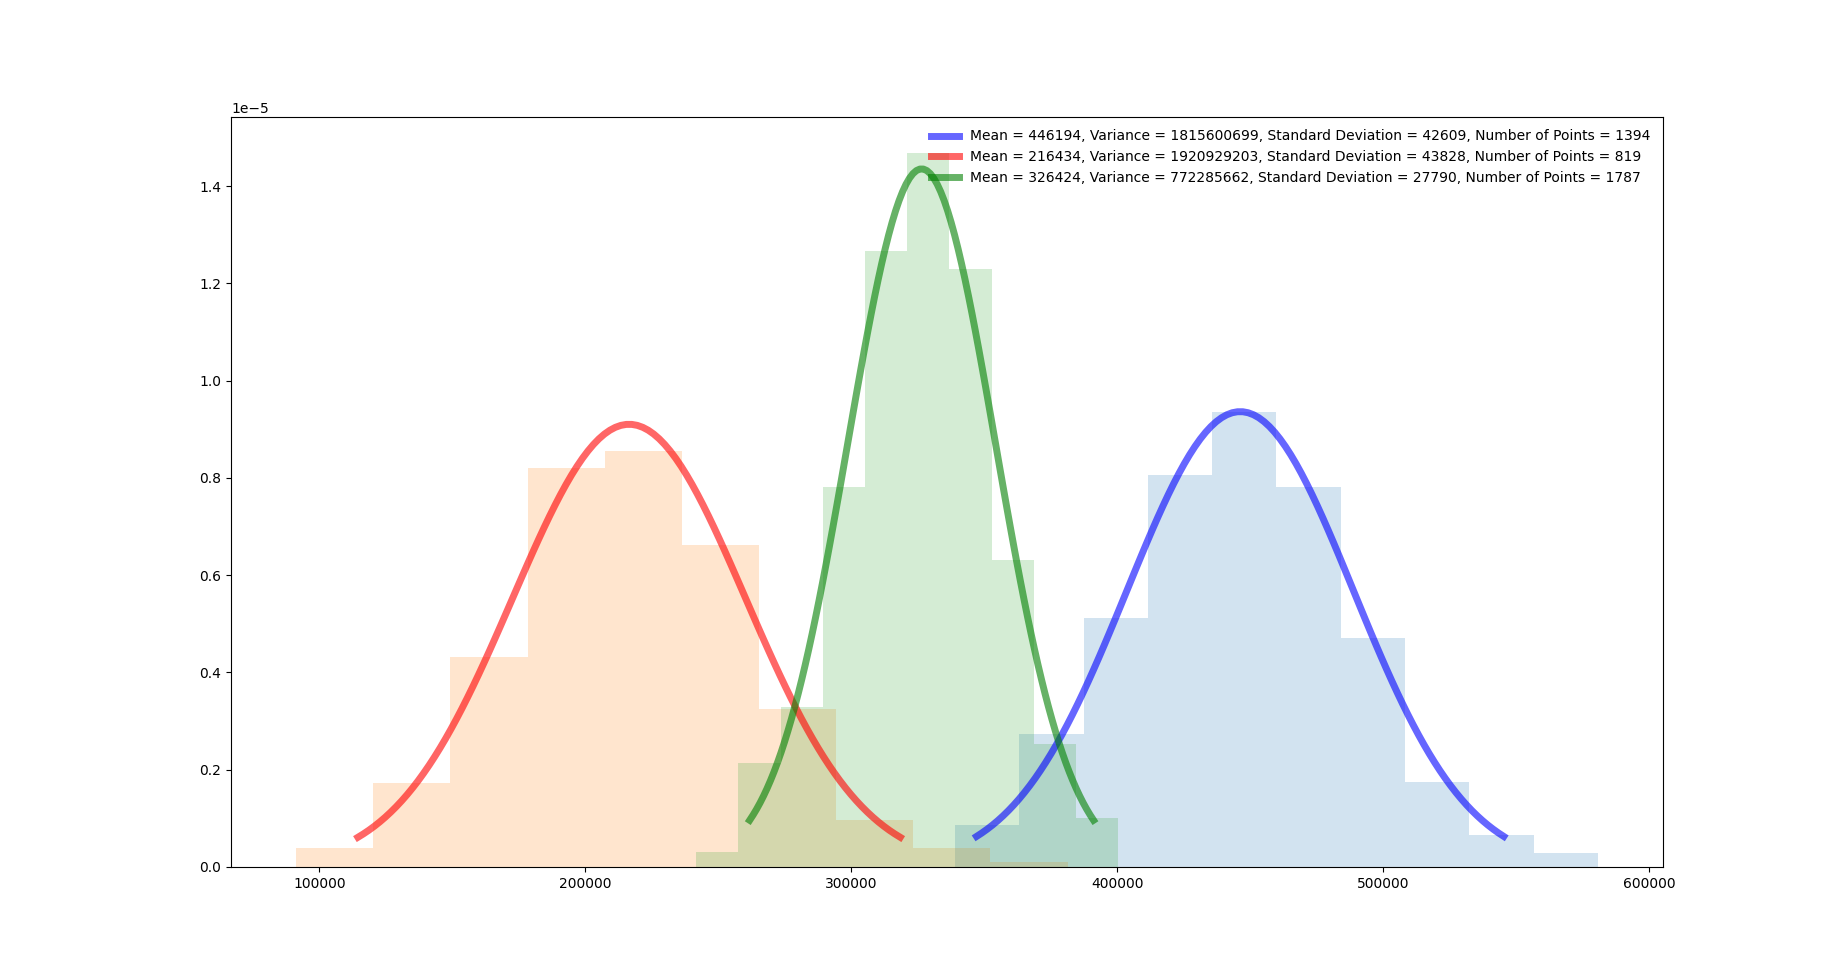
Further analysis of this plot reveals the following issues:
There might exist 3 distinct distributions. I.e. it is possible to almost reliably (i.e. with high probability (whp)) differentiate between three different kinds of timings. This suggests that the types of timings are:
refillis called. Expected to be linked to the distribution with the highest mean.popBatchhas a batch in the free listpopBatchhas to callpopulateFreeList–> expected to take a lot of time.
getTSDAndLocktakes longer, i.e. synchronization blocks execution.allocateinstantly returns a chunk.
Notice that currently, there is NO CERTAIN MAPPING between the first two types of timings and the two distributions with the highest means. However, whp. the distribution with the lowest mean is linked to the event that
allocateinstantly returns a chunk.Assuming the distribution with the smallest mean is linked to the event that
allocateinstantly returns a chunk and that at least one distribution is caused by multithreading, then with probability at leastmin(1394 / 4000, 1787 / 4000) = min(0.3485, 0.44675)the TSD is shared with another thread.Another “distortion” that could appear, but is very improbable, is that
crc32calculation takes very long for specific values. As this has been empirically tested, this can be ruled out for now (I searched for values, which cause long execution times in thecrc32instruction… without success).Calling JNI functions can non - deterministically cause longer execution times e.g. by calling
mallocinternally.
If the amount of points in the two distributions with the highest means are proportional to the total amount of points, then this rules out the possibility that the free list is filled with a lot of batches initially, because there can only be a constant amount of batches initially stored in the free list. Therefore, increasing the amount of allocations will reveal whether the amount of points in both distributions grows with the amount of allocations.
Also, notice that our thread will permanently allocate memory via malloc(0x10). If there was another thread that freed memory using free on previously allocated classid - 1 chunks (assuming no memory leaks), then this cannot create a new batch, i.e. result in drain and therefore pushBatch being called, because our thread will not call free at all (of course there might be implicit calls to free, but they would not be part of Scudo). In addition to that, as Java threads have a 1 - 1 mapping with user - level threads (pthread_create), there cannot be multiple threads running handleMessage.
Interestingly, it turns out that one call to the JNI function may cause multiple internal malloc calls from the same or a TSD - sharing thread. E.g., if each remote malloc resulted in two malloc calls, i.e. one internal call and the call we requested, then, assuming C->Count < 13, there will be six fast calls and one slow call. The timings used for analysis so far may contain multiple malloc calls, which explains the existence of three distributions. Two of those three distributions are actually the same only with shifted means, one contains the timings with only one malloc, the other one with two calls to malloc. This is due to the fact that handleMessage seems to call malloc at most twice, but at least once. Therefore, the distributions with the smallest and biggest means seem to represent one malloc and two mallocs without refill respectively, whereas the “middle” distribution seems to represent a single allocation with refill…although this does not really make sense, because there would have to be a lot of refills…
In order to prove that synchronization is an issue and that one call to handleMessage can cause two malloc calls, consider the following analysis (performed via gdb):
<Index of handleMessage call>(length = <amount cache allocations per handleMessage>):
    <Thread ID>: count=<C->Count value>, id=<Class ID>

0(length = 0):
1(length = 1):
    20: count=0xb, id=0x00000020
2(length = 2):
    20: count=0xa, id=0x00000020
    20: count=0x9, id=0x00000020
3(length = 1):
    20: count=0x8, id=0x00000020
4(length = 2):
    20: count=0x7, id=0x00000020
    20: count=0x6, id=0x00000020
5(length = 0):
6(length = 0):
7(length = 2):
    20: count=0x5, id=0x00000020
    20: count=0x4, id=0x00000020
8(length = 2):
    20: count=0x3, id=0x00000020
    20: count=0x2, id=0x00000020
9(length = 1):
    20: count=0x1, id=0x00000020
10(length = 1):
    20: count=0x0, id=0x00000020
11(length = 1):
    20: count=0xc, id=0x00000020
12(length = 1):
    20: count=0xb, id=0x00000020
13(length = 0):
14(length = 2):
    20: count=0xa, id=0x00000020
    20: count=0x9, id=0x00000020
15(length = 0):
16(length = 0):
17(length = 1):
    20: count=0x8, id=0x00000020
18(length = 1):
    20: count=0x7, id=0x00000020
19(length = 0):
20(length = 2):
    20: count=0x6, id=0x00000020
    20: count=0x5, id=0x00000020
21(length = 1):
    20: count=0x4, id=0x00000020
22(length = 1):
    20: count=0x3, id=0x00000020
23(length = 0):
24(length = 1):
    20: count=0x2, id=0x00000020
25(length = 1):
    20: count=0x1, id=0x00000020
26(length = 0):
27(length = 2):
    20: count=0x0, id=0x00000020
    20: count=0xc, id=0x00000020
28(length = 1):
    20: count=0xb, id=0x00000020
29(length = 1):
    20: count=0xa, id=0x00000020
30(length = 0):
31(length = 0):
32(length = 2):
    20: count=0x9, id=0x00000020
    20: count=0x8, id=0x00000020
33(length = 1):
    20: count=0x7, id=0x00000020
34(length = 1):
    20: count=0x6, id=0x00000020
35(length = 3):
    20: count=0x5, id=0x00000020
    5: count=0x5, id=0x00000020
    20: count=0x4, id=0x00000020
36(length = 2):
    20: count=0x3, id=0x00000020
    20: count=0x2, id=0x00000020
37(length = 2):
    20: count=0x1, id=0x00000020
    20: count=0x0, id=0x00000020
38(length = 2):
    20: count=0xc, id=0x00000020
    20: count=0xb, id=0x00000020
39(length = 2):
    20: count=0xa, id=0x00000020
    20: count=0x9, id=0x00000020
40(length = 0):
41(length = 0):
42(length = 1):
    20: count=0x8, id=0x00000020
43(length = 1):
    20: count=0x7, id=0x00000020
44(length = 2):
    20: count=0x6, id=0x00000020
    20: count=0x5, id=0x00000020
45(length = 0):
46(length = 0):
47(length = 1):
    20: count=0x4, id=0x00000020
48(length = 0):
49(length = 1):
    20: count=0x3, id=0x00000020
50(length = 1):
    20: count=0x2, id=0x00000020
51(length = 1):
    20: count=0x1, id=0x00000020
52(length = 2):
    20: count=0x0, id=0x00000020
    20: count=0xc, id=0x00000020
53(length = 0):
54(length = 0):
55(length = 0):
56(length = 1):
    20: count=0xb, id=0x00000020
57(length = 1):
    20: count=0xa, id=0x00000020
58(length = 1):
    20: count=0x9, id=0x00000020
59(length = 2):
    20: count=0x8, id=0x00000020
    20: count=0x7, id=0x00000020
60(length = 0):
61(length = 2):
    20: count=0x6, id=0x00000020
    20: count=0x5, id=0x00000020
62(length = 0):
63(length = 0):
64(length = 0):
65(length = 0):
66(length = 1):
    20: count=0x4, id=0x00000020
67(length = 1):
    20: count=0x3, id=0x00000020
68(length = 1):
    20: count=0x2, id=0x00000020
69(length = 0):
70(length = 1):
    20: count=0x1, id=0x00000020
71(length = 0):
72(length = 1):
    20: count=0x0, id=0x00000020
73(length = 1):
    20: count=0xc, id=0x00000020
74(length = 1):
    20: count=0xb, id=0x00000020
75(length = 1):
    20: count=0xa, id=0x00000020
76(length = 2):
    20: count=0x9, id=0x00000020
    20: count=0x8, id=0x00000020
77(length = 2):
    20: count=0x7, id=0x00000020
    20: count=0x6, id=0x00000020
78(length = 8):
    5: count=0x5, id=0x00000020
    5: count=0x4, id=0x00000020
    5: count=0x3, id=0x00000020
    5: count=0x2, id=0x00000020
    5: count=0x2, id=0x00000020
    5: count=0x2, id=0x00000020
    5: count=0x2, id=0x00000020
    20: count=0x4, id=0x00000020
79(length = 3):
    5: count=0x4, id=0x00000020
    20: count=0x4, id=0x00000020
    20: count=0x3, id=0x00000020
80(length = 1):
    20: count=0x2, id=0x00000020
81(length = 2):
    20: count=0x1, id=0x00000020
    20: count=0x0, id=0x00000020
82(length = 1):
    20: count=0xc, id=0x00000020
83(length = 2):
    20: count=0xb, id=0x00000020
    20: count=0xa, id=0x00000020
84(length = 2):
    20: count=0x9, id=0x00000020
    20: count=0x8, id=0x00000020
85(length = 0):
86(length = 2):
    20: count=0x7, id=0x00000020
    20: count=0x6, id=0x00000020
87(length = 1):
    20: count=0x5, id=0x00000020
88(length = 1):
    20: count=0x4, id=0x00000020
89(length = 1):
    20: count=0x3, id=0x00000020
90(length = 1):
    20: count=0x2, id=0x00000020
91(length = 0):
92(length = 0):
93(length = 1):
    20: count=0x1, id=0x00000020
94(length = 2):
    20: count=0x0, id=0x00000020
    20: count=0xc, id=0x00000020
95(length = 2):
    20: count=0xb, id=0x00000020
    20: count=0xa, id=0x00000020
96(length = 0):
97(length = 1):
    20: count=0x9, id=0x00000020
Thread 20 is the main thread calling handleMessage. Its allocations are interleaved with allocations from thread 5. Notice that there are no inconsistencies in the above measurement, although it seems impossible for count to stay the same. This is due to thread 5 calling free in between calls to malloc.
Therefore, there is at least one other thread sharing the same TSD as our thread. As execution in gdb is “weird” sometimes, it can be assumed that multi - threading is even worse if no debugger is present. Overall, with at least one other thread interleaving and with uncertainty whether one call to handleMessage results in one or two calls to malloc, there seems to be no clear path to derive the actual value for C->Count.
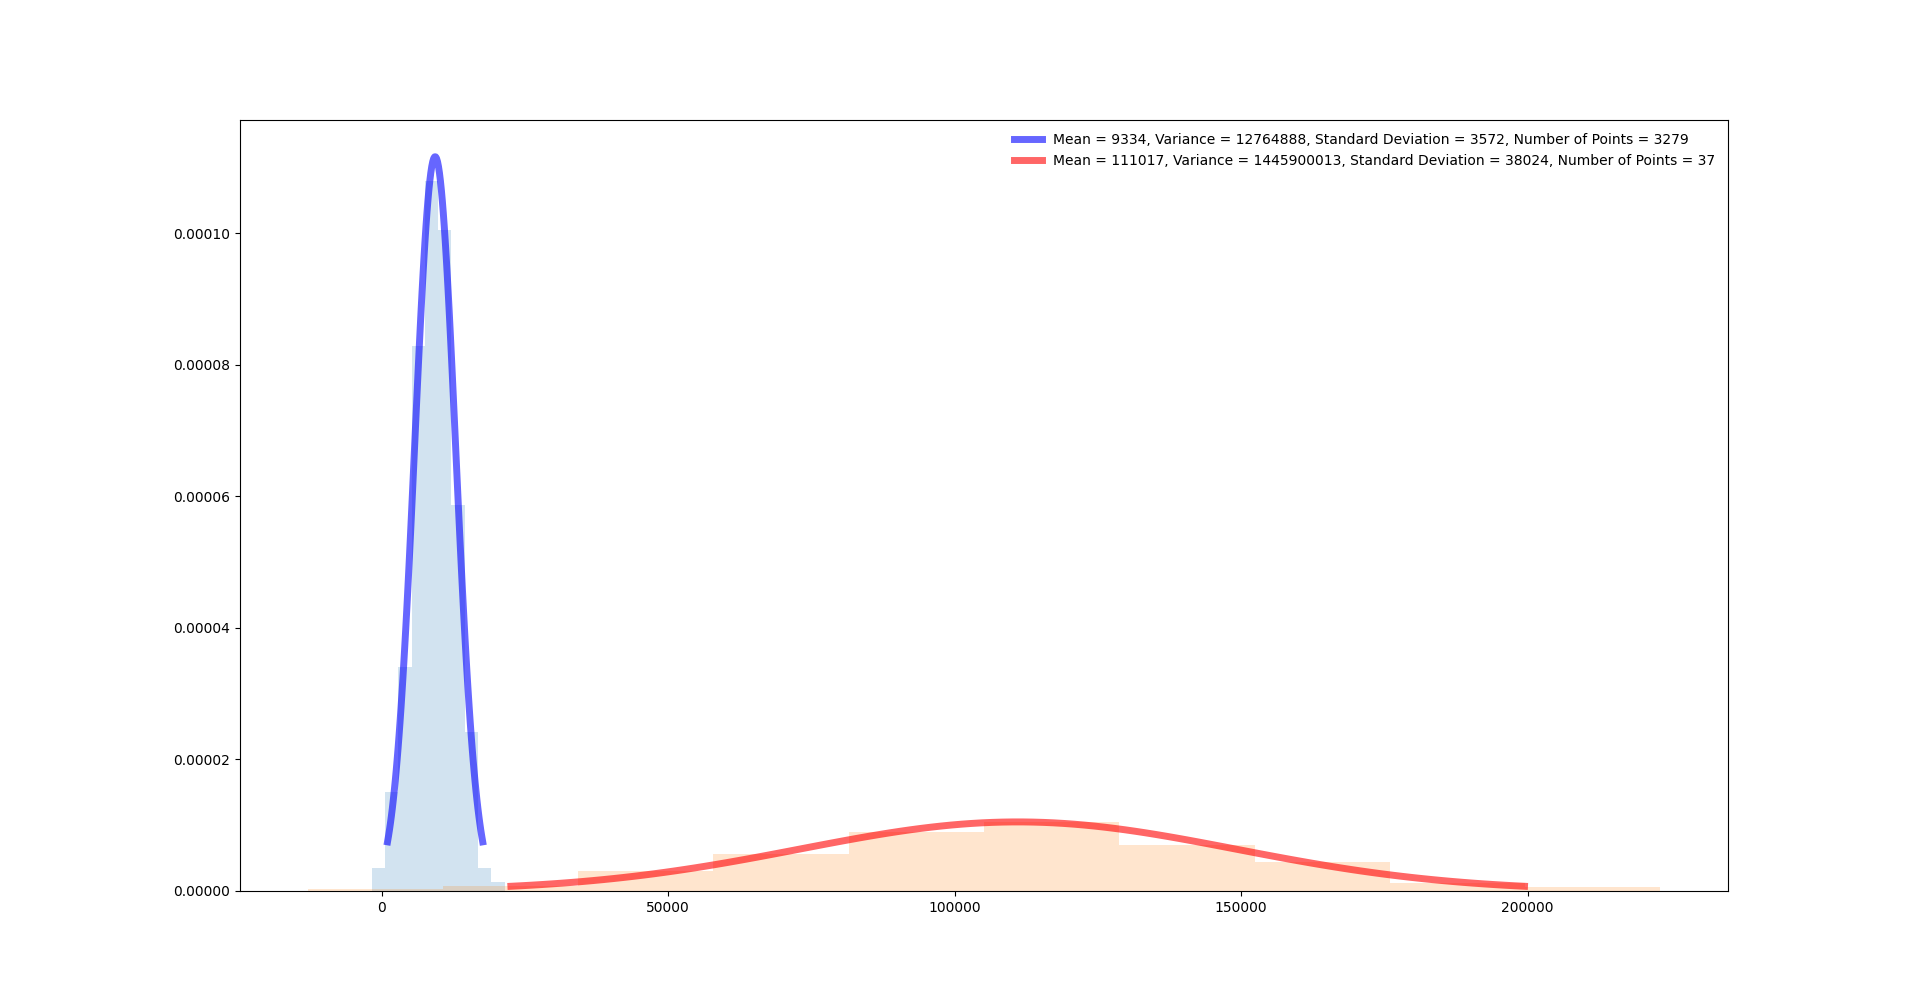
Analysing Accurate Measurements
Performing timing analysis on the actual device, i.e. in the form of
clock_gettime(CLOCK_THREAD_CPUTIME_ID, &before);
ptr = malloc(size);
clock_gettime(CLOCK_THREAD_CPUTIME_ID, &after);
elapsed = (after.tv_sec * NS_PER_SECOND + after.tv_nsec) - (before.tv_sec * NS_PER_SECOND + before.tv_nsec);
reveals an interesting and quite natural result:
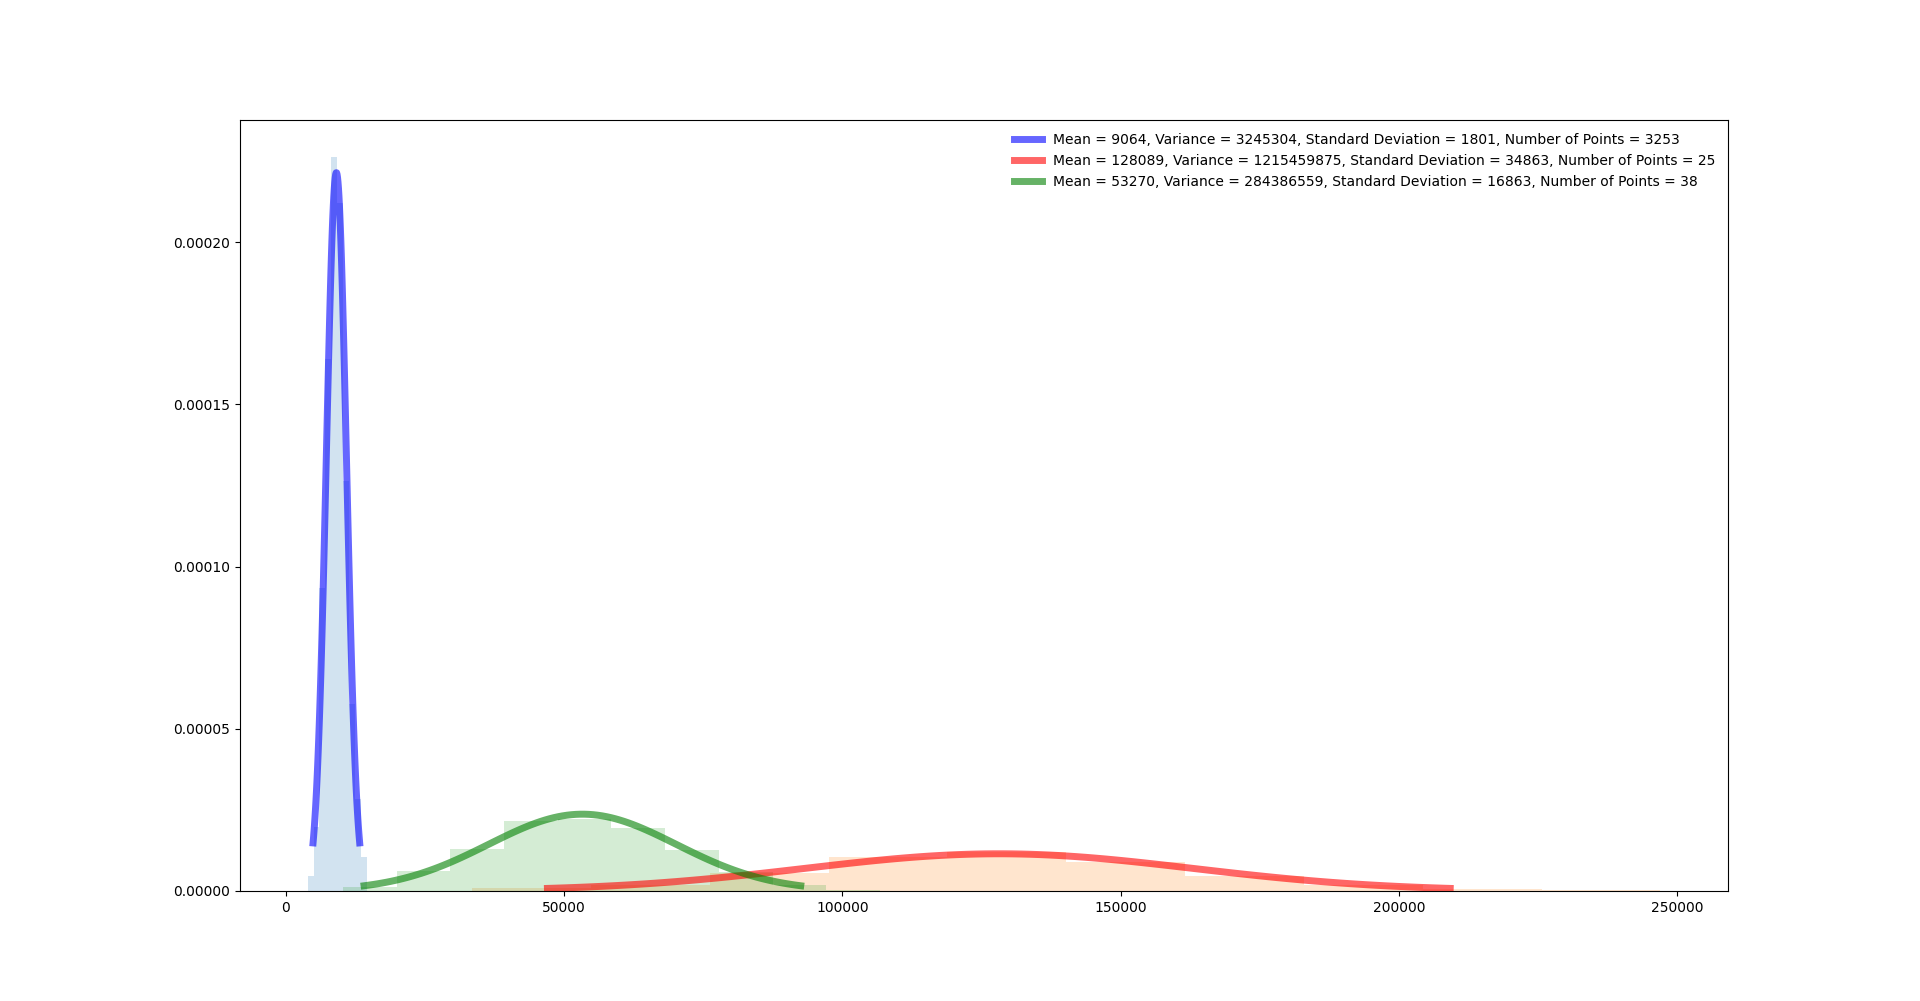
Mapping three distributions to the same set of measurements yields:
Notice that these measurements are stripped off multiple layers of noise:
- Noise introduced by remote communication
- Noise introduced by an arbitrary amount of function calls required for e.g. setting up a JNI call.
- Some synchronization of threads. Notice that measuring the elapsed time for
malloc(0x10)directly requires no further data fetching and therefore less threads are involved…
Attacking Secondary Cache
Naturally, we could also try to attack the secondary cache via a timing attack. As with classical cache - based side channel attacks, we would expect:
- fast execution time, if entry is in cache, i.e. cache hit
- slow execution time, if entry is not in cache, i.e. cache miss
Unfortunately, my experiments have been shut down by the fact that there is only one secondary for all threads. From experience, damnvulnerableapp:VulnerableActivity uses at least 20 threads. The experiment consisted of two events, i.e. cache hit and cache miss:
cache hit:
For the experiment, we repeat n times:
- Allocate chunk via secondary
- Free chunk
- Measure time required in 1.
From the second iteration onwards, assuming no other threads steals the freed chunk from the cache, allocations are assumed to be fast. Statistics are taken over 400 measurements (repeated three times):
- avg = 351142.4975, var = 6215682405.529994, standard dev = 78839.59922228166; Without first: avg = 350635.6090225564, var = 6128486185.496259, standard dev = 78284.64846632614`
- avg = 293603.4925, var = 9048178621.879944, standard dev = 95121.91451963078; Without first entry: 292885.1203007519, 8864432314.622118, 94151.11425056061
- avg = 343784.9075, var = 8457856232.698944, standard dev = 91966.60389890966; Without first entry: 343308.24812030076, 8388172201.665255, 91586.96523886603
cache miss:
For the experiment, we repeat n times:
- Allocate chunk via secondary
- Measure time required in 1.
In the worst case, the first 32 allocations are covered by cache entries. Assuming that no other thread frees a lot of memory that results in chunks, which cover our requests, we end up with the following results (over 400 measurements, repeated twice):
- avg = 353609.1975, var = 7648425849.838493, standard dev = 87455.27914219069; Without first 32 entries: 354754.0652173913, 7595866298.691399, 87154.26724315567
- avg = 320303.5725, var = 7655033941.299744, standard dev = 87493.05081719201; Without first 32 entries: 320182.16576086957, 7793835282.176328, 88282.70092252687
As can be seen from the repeated experiments, there seems to be no clear way for distinguishing secondary cache hits and misses. This might be due to the fact that there are roughly 20 threads sharing the same 32 cache entries! If we knew the distribution behind some random variable X that represents the amount of secondary allocate calls done in between two allocations performed by our thread, then we might be able to derive a probability distribution on the measured timings and maybe derive the most probable outcome, i.e. either cache hit or miss. But this seems like a rabbit hole, i.e. it does not seem to help in exploiting Scudo.
Conclusion
So, what is the result of the above “attacks” that do not really achieve anything… Well, I argue that we actually achieved something without knowing that we achieved it, i.e. we can identify whether there are sometimes one and sometimes two calls to malloc when running handleMessage.
Recall the visualization of the measurements:
Of course, the above diagram is composed of measuring only 4000 execution times. Still, we can tell whether a new time measurement belongs to either the red or the blue distribution with high probability, if the assumption is correct that the red and blue distributions represent one and two calls to malloc, respectively! Adding to the pile, being able to distinguish time measurements like shown in the diagram suggests that there is some underlying information to be extracted. Notice that the distributions shown in the diagram come from time measurements taken over a JNI call and not a malloc call directly!
As can be seen from the measurements taken locally , Scudo leaks information through execution times and thus is not designed to mitigate timing attacks. Further analyses are required to apply and evaluate the whole potential of side channel attacks on Scudo.
Unfortunately, I am neither a data scientist nor an expert in statistics or side channel attacks. Hence, the analyses conducted in this blog post are very basic and, again, might be incorrect and/or incomplete.
Therefore, attacking Scudo in terms of timing attacks has to be postponed until a corresponding expert joins the game.