Fundamentals for Bytecode Exploitation (Part 2)
Exploiting a vulnerability always requires a certain knowledge about the operating system, including how processes are launched, what libraries are used and how control - flow “works”. While the latter could be considered coming from the architecture, this is not always the case on Android, because the Android RunTime (ART) provides ways to call bytecode methods and redirect bytecode control - flow. Hence, ART dictates how bytecode control - flow works, not directly the underlying CPU. Understanding the above mechanisms is the minimal requirement for understanding bytecode - based exploitation. Based on that, more sophisticated analysis techniques can be built specifically for Android bytecode, to make bytecode - based exploitation feasible.
In this blog post, we first dive into how Android bytecode methods are invoked, which entails a discussion about how Java classes, objects, methods and fields are handled in memory by ART. Then, we take a look at Android’s fork server architecture. Building on this, interesting memory regions common to all Android apps are discussed, which include .dex, .so, .art and .oat files. During all of this, I showcase analysis methods used to practically verify the discussed topics.
Android Runtime
Every Android app contains the libart.so library, which is the ART implementation. This is probably the most vital library for Android apps! Not only that, but from the perspective of an attacker trying to abuse a memory error in a JNI function, libart.so is gadget heaven. Among other things, libart.so is responsible for executing bytecode. Further, it dictates the memory layout of methods, fields, classes and thus objects. We start off with some basics on ART structures and Android bytecode, then discuss how Android bytecode is executed.
ART Structures
Bytecode operates on data representing methods, fields, classes, objects and more. Therefore, before looking into concrete bytecode implementations, these structures must be discussed. From now on, we assume we are looking at an app written in Java. Also, we do not consider inheritance for simplicity.
The most famous structure is probably the (Java) object, which is defined in mirror::Object
. Surprisingly, an object consists of only two fields:
class Object {
    HeapReference<Class> klass_;    // 32-bit value
    uint32_t monitor_;
}
Overall, this means an object is just a 64 - bit value, which seems odd given the fact that in Java we can access all kinds of fields. Conceptually comparable to how Chromium’s JavaScript engine V8 handles dynamic objects using the “static” language C++, Android uses a mirror::Class
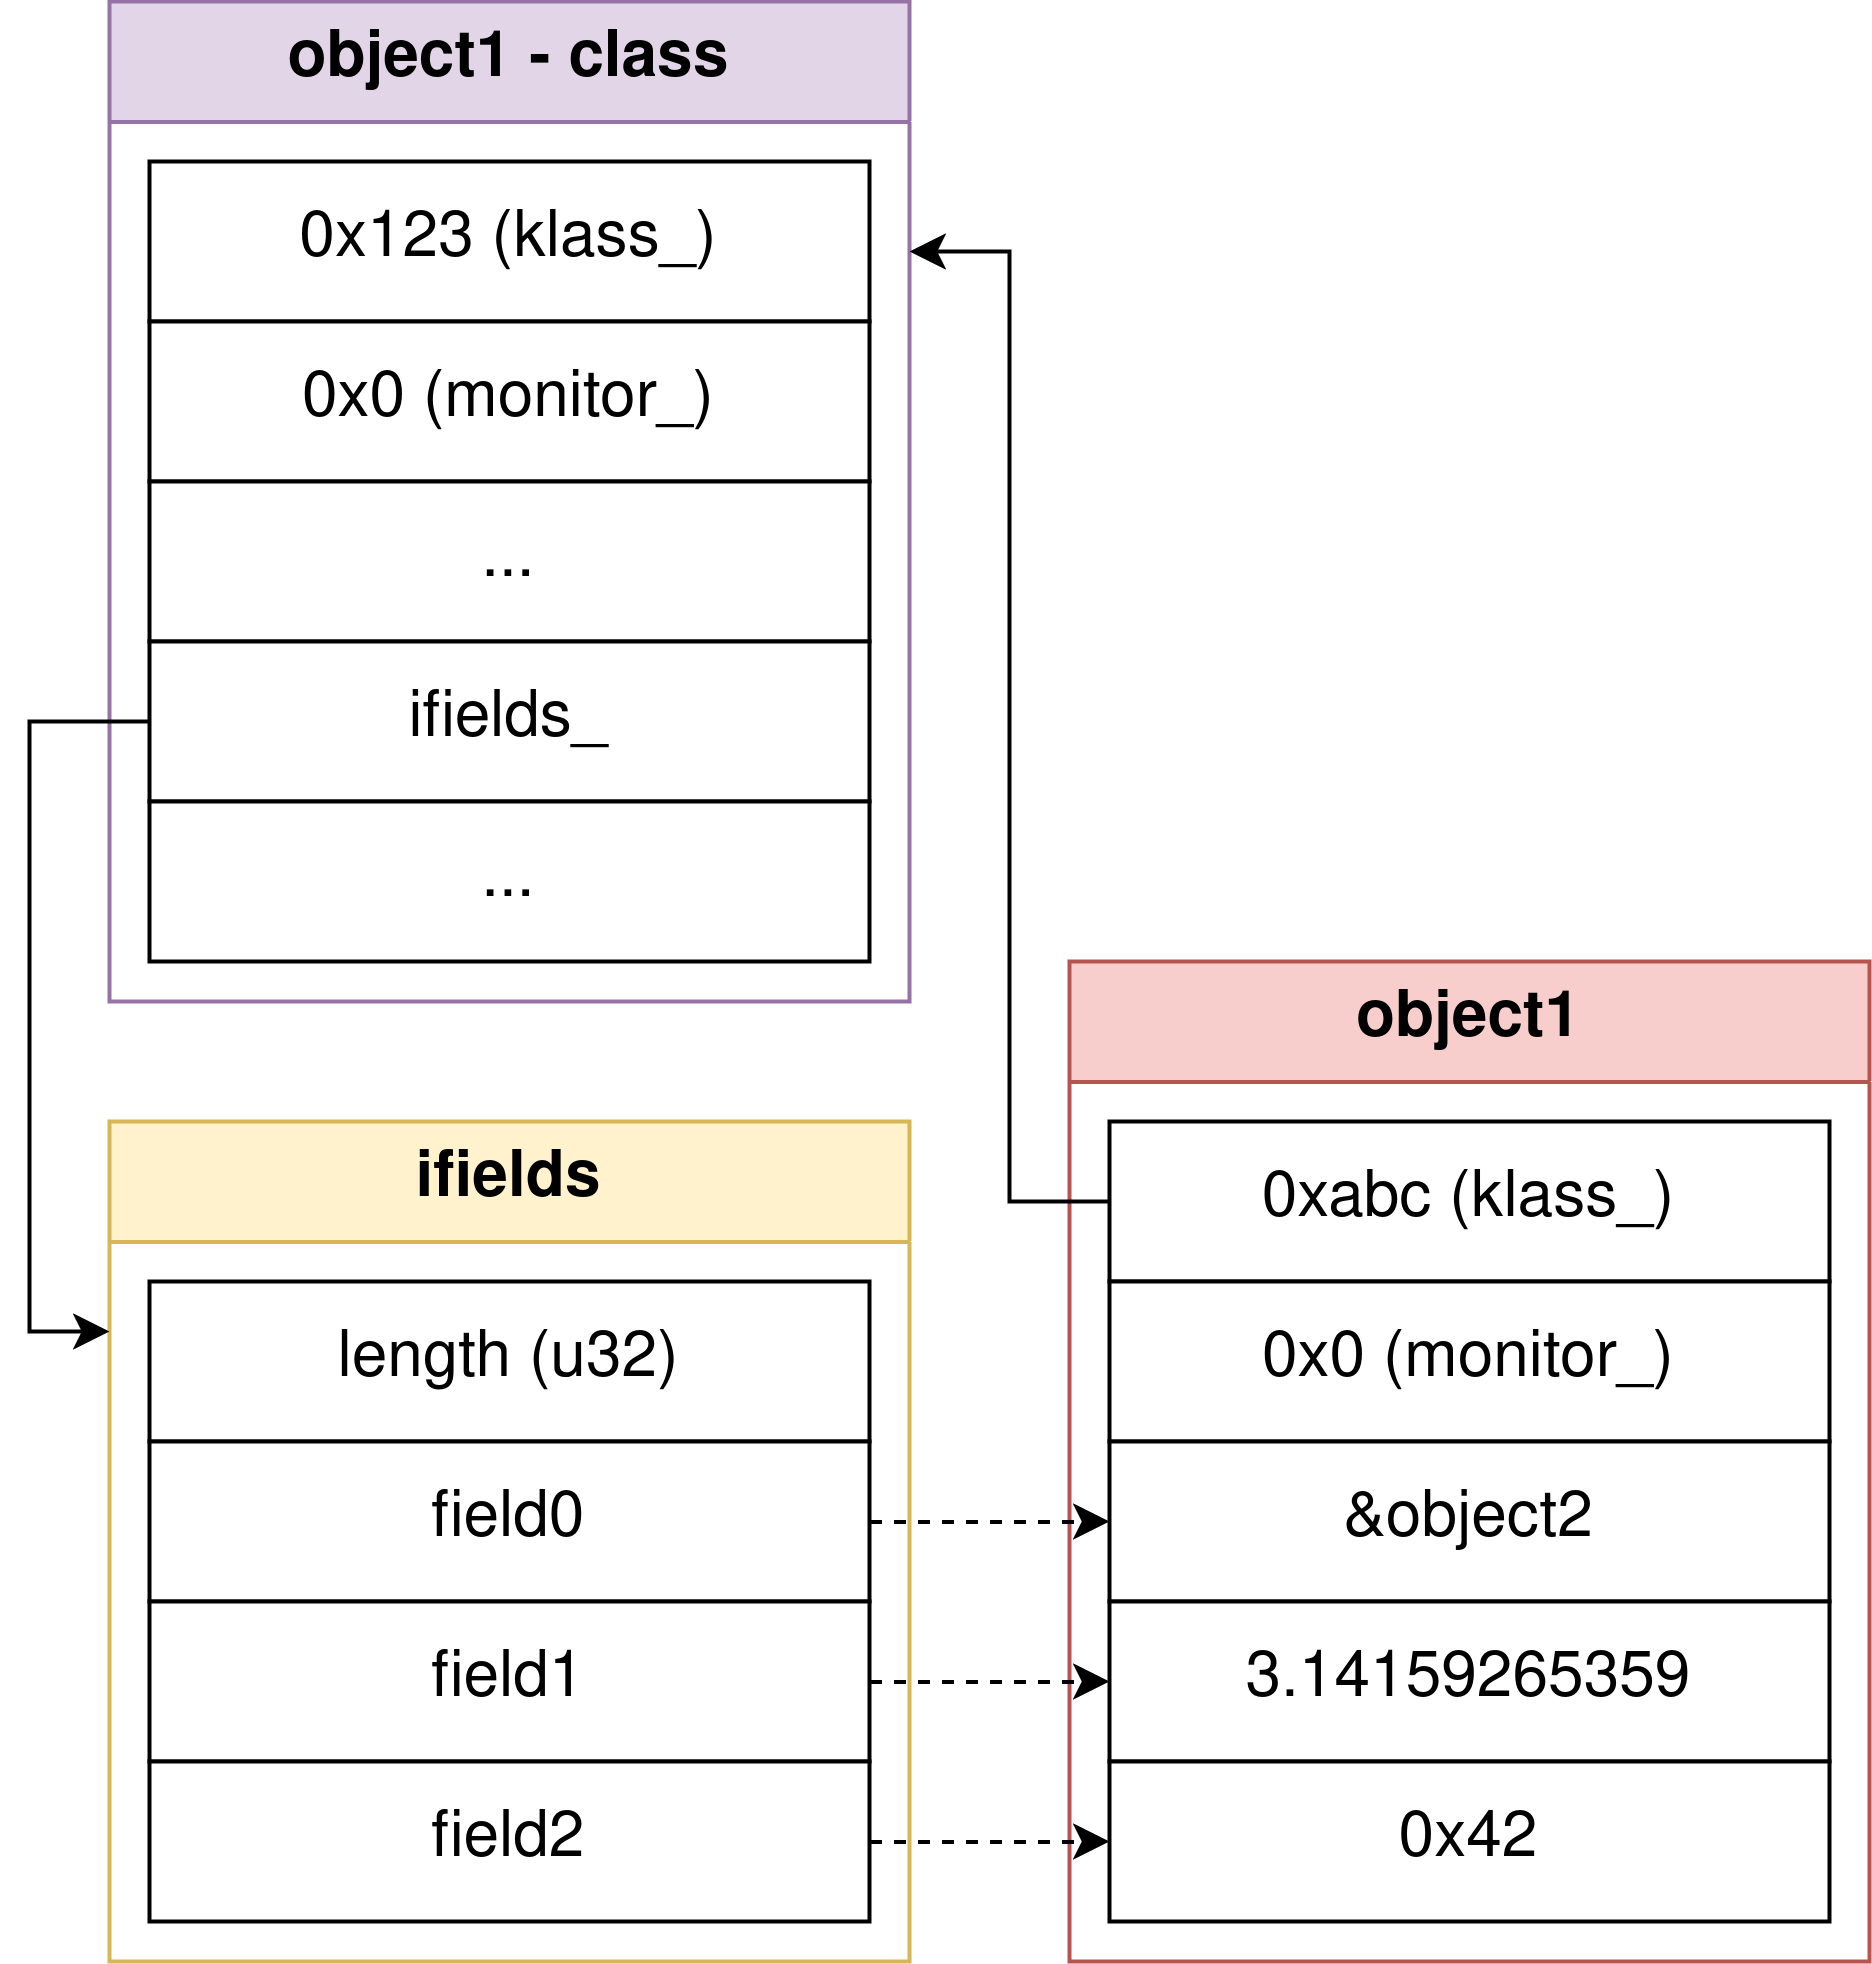
to define where to find the fields of an object. So, although the C++ representation of an object does not explicitly account for all accessible fields, in memory an object is followed by the concrete values of its fields. The associated Class stored in object->klass_ contains an array of ArtField
objects called Class::ifields_. Each ArtField represents a single field by specifying e.g. the field’s type, access flags (like private) and offset relative to the end of the C++ object in memory. Fields stored relative to an object/instance are called instance fields. Static fields are stored relative to the Class.
In other words, an object looks like this in memory:
0x00: object->klass_
0x04: object->monitor_
0x08: object->field0
0x0c: object->field1
...
Usually, fields are 32 - bit values, but some primitive types like long and double require 64 bits. Because ArtFields only tell the runtime where to find a field inside an object’s memory and what type that field is, objects are very dynamic in terms of shape. By the way, speaking V8, the Class is somewhat similar to the shape of an object. Consider the following visualization:
Although there can be many fields for a particular class instance, Android enforces a particular field order . Hence, unless e.g. field types change, the field order inside an object is constant and thus predictable.
Regarding method invocations, Android utilizes a structure called ArtMethod
. The comments indicate what a field means for a bytecode method:
class ArtMethod {
    uint32_t access_flags_; // A lot of potential flags like "public"
    uint32_t dex_method_index_; // Index into .dex file (context)
    uint16_t method_index_; // Index into vtable (?)
    union {
        uint16_t hotness_count_;    // How often this method is called. Triggers JIT compilation on 0, else > 0.
        uint16_t imt_index_;    // Index into Interface Method Table (IMT)
    };
    struct PtrSizedFields {
        void *data_;    // Reference to code_item in .dex file
        void *entry_point_from_quick_compiled_code_;    // Reference to ExecuteNterpImpl
    } ptr_sized_fields_;
}
Of course, an ArtMethod does not necessarily need to represent a bytecode method. The ART provides many kinds of methods, of which a bytecode method is just a single instance.
There are various ways an ArtMethod can be linked into a Class, because e.g. Java provides many different types of methods and thus method invocations. For example, if a method is “normal”, like
class Me {
    public void run() {
        System.out.println("What am I reading??");
    }
}
...
new Me().run();
then the method run is invoked via the invoke-virtual bytecode. This means that (a pointer to) the ArtMethod is stored inside the embedded vtable of the class Me, which is located right behind the Class object in memory.
Obviously, things are never simple. To avoid method resolution everytime a method is invoked, Android uses multiple caching layers, one of which is implemented by the DexCache
class. In a nutshell, a DexCache is linked to a single .dex
file and tries to prevent the runtime from repeatedly parsing the .dex file to e.g. get a type definition. Every Class instance is linked to a single DexCache instance. When invoking a method on an object, the DexCache associated with the class that declares the calling method is used to look up the ArtMethod before parsing the .dex file (if no lower cache layer contains the method). This means any method is bound to a single DexCache and thus to a single .dex file, which I define as the context of a bytecode method. Each method is restricted to the types, methods etc. defined in the context, i.e. the .dex file of the DexCache associated with the declaring class of the method.
Notice we are only scratching the surface! In a later post, we will investigate how interface method invocation works in detail. Also, observe that there are a lot of cross - references among the above structures. Objects reference their classes, which again reference methods each pointing back to their declaring class. Fields have relative pointers into objects and are referenced by a class. This is what makes understanding and manipulating such structures highly complicated!
Android Bytecode
Android bytecode
(actually called Dalvik bytecode, but whatever), is what is executed by Android’s interpreters. As we focus on Android 13, the main interpreter is called nterp
and is mostly written in assembly. There is another interpreter called the switch interpreter, written in C++, but it seems to be rarely used. A single bytecode instruction consists of at least two bytes. Moreover, the number of bytes required for each bytecode instruction is divisible by two. This stems from the fact that bytecode works with so called code units, where 1 code unit = 2 bytes.
Lets consider an example:
01 12x move vA, vB
Actually, the instruction is move vA, vB, because the value 0x01 is the opcode indicating that this instruction is a move and 12x is the format
of the instruction. E.g. 12x means op vA, vB. A concrete instance of the above instruction would be
move v0, v1
where the value in virtual register v1 is moved/copied into vreg v0. On Intel x64, this is somewhat similar to mov eax, ebx.
A single vreg can hold a 32 - bit value. Further, each vreg is associated with a virtual reference (vref), which also holds 32 bits. However, vrefs are never accessed directly, i.e. there will never be an instruction like move rA, rB. Instead, vrefs are used to handle object references in the background. For example, let r0 be the vref associated with vreg v0. If v0 holds an integer, i.e. a non - object value, then r0 = 0. However, if v0 holds an object, then r0 also holds the same object. Of course, holding an object means holding an object reference, which must be a valid 32-bit pointer. Depending on what the method containing the bytecode requested, more vregs may be accessible, like v1 or v65535. Vreg indices are always unsigned and not only depend on what the method requested, but also on the bytecode operating on the vreg.
In memory, the above example move v0, v1 looks like so:
01 10
As stated earlier, 01 is the opcode indicating a move. Furthermore, the format op vA, vB indicates that vreg indices are 4 bits each. Basically, each letter in a vreg description, like A in vA, represents another 4 bits available to encode a vreg index. In this case, vA and vB may range from v0 to v(2**4-1)=v15. When writing Java code, there is no way to manually specify the vreg indices. However, when writing bytecode shellcode, care must be taken to not exceed bytecode instruction - enforced ranges. Otherwise, indices may be different from what is needed in the exploit, or throw off following bytecode instructions.
One pecularity remains to be discussed: why is v0, v1 translated to 10 in the above example? This stems from the little - endian architecture of the test device. Basically, the format enforces a memory layout like so 01 BA.
Lets consider another example: a “normal” method invocation
6e 35c invoke-virtual {vC, vD, vE, vF, vG}, meth@BBBB
Similar to before, vC to vG are given 4 bits each to index the vregs that hold method arguments. Two things are odd though:
- Where is
Ain the above definition? - What is
meth@BBBB?
Regarding the first point, A is a 4 bit value that determines the actual number of arguments passed. Otherwise, any method invocation via invoke-virtual would be forced to handle exactly 5 arguments. Secondly, meth@BBBB is a 16 - bit unsigned index into the method table of the .dex file of the calling/current method, i.e. the context. To make sure this is clear, consider the following example:
public void run() {
    ...
    invoke-virtual {v0, v1}, meth@1234
    ...
}
Here, the context is the .dex file associated with the ArtMethod representing run! Therefore, if we try to call a method that does not appear inside the context, like Runtime::exec(String command), then an error will be thrown or worse a method with the same method index will be called and cause a crash!
The format of invoke-virtual dictates a memory layout like 6e AG BB BB DC FE. If A < 5, then any superfluous vreg indices are set to 0, although they are ignored anyways. Of course, BBBB is stored in little endian.
Finally, lets consider one last example: creating arrays directly from bytecode
26 31t fill-array-data vAA, +BBBBBBBB
This time, vAA may be any of v0 to v255. Furthermore, +BBBBBBBB is a 32-bit signed branch offset relative to the address of this instruction in code units. Assuming dex_pc is the virtual address of a fill-array-data instruction, to compute the address this instruction is referencing do the following: dex_pc + 2 * (+BBBBBBBB). Because the 32-bit value is signed, whatever is referenced may be located above or below the instruction. Interestingly, the data structure referenced is a fill-array-data-payload:
| Name | Format |
|---|---|
| ident | 0x0300 (u16) |
| element_width | u16 |
| size | u32 |
| data | [u8] |
Note: Java uses two bytes for a single char. So, to create a
char[]directly from bytecode, we must ensure thatelement_width = 2. Bytecode is full of such caveats!
Android Bytecode Execution
Execution of bytecode requires an interpreter, in this case nterp. Given an ArtMethod, the interpreter starts with ExecuteNterpImpl
. It sets up the execution environment, which includes
- Spilling registers on stack. Bytecode uses fixed hardware registers , just like native code.
- Allocating memory for vregs and vrefs. These are initialized to
0. - Setting up arguments to be passed to the invoked method.
Below are the most important hardware registers and their descriptions:
| Register | Description |
|---|---|
| x19 | Thread pointer |
| x29 | Interpreted frame pointer |
| x25 | Base of vrefs |
| x22 | Interpreted program counter (dex_pc) |
Usually, native code execution involves managing stack frames, which seems daunting considering the complexity of ART. Luckily, the documentation of nterp, despite spread over various files, is pretty good. Hence, the nterp stack layout
is fully documented:
/*    ----------------
 *    |              |      All callee save registers of the platform
 *    | callee-save  |      (core and floating point).
 *    | registers    |      On x86 and x64 this includes the return address,
 *    |              |      already spilled on entry.
 *    ----------------
 *    |   x86 args   |      x86 only: registers used for argument passing.
 *    ----------------
 *    |  alignment   |      Stack aligment of kStackAlignment.
 *    ----------------
 *    |              |      Contains `registers_size` entries (of size 4) from
 *    |    dex       |      the code item information of the method.
 *    |  registers   |
 *    |              |
 *    ----------------
 *    |              |      A copy of the dex registers above, but only
 *    |  reference   |      containing references, used for GC.
 *    |  registers   |
 *    |              |
 *    ----------------
 *    |  caller fp   |      Frame pointer of caller. Stored below the reference
 *    ----------------      registers array for easy access from nterp when returning.
 *    |  dex_pc_ptr  |      Pointer to the dex instruction being executed.
 *    ----------------      Stored whenever nterp goes into the runtime.
 *    |  alignment   |      Pointer aligment for dex_pc_ptr and caller_fp.
 *    ----------------
 *    |              |      In case nterp calls compiled code, we reserve space
 *    |     out      |      for out registers. This space will be used for
 *    |   registers  |      arguments passed on stack.
 *    |              |
 *    ----------------
 *    |  ArtMethod*  |      The method being currently executed.
 *    ----------------  <----- STACK POINTER: qword [SP] = ArtMethod*
 */
Hence, vrefs and vregs are adjacent arrays of 32-bit values. Furthermore, way up the stack are callee - save registers, which will include the dex_pc of the calling function, if the calling function is also a bytecode method, i.e. there is a new return address - do you see where this is going? >:)
Bytecode Oddities
With the basics out of the way, lets quickly gloss over some weird things in bytecode. It seems like Android’s interpreter nterp is making the following assumption:
Bytecode is correct.
This is well - founded under another assumption that bytecode can only originate from e.g. Java or Kotlin. However, in a setting where an attacker is able to control e.g. a stack - buffer overflow, so that the stored bytecode return address is overwritten to point to attacker - controlled memory, this assumption does not hold anymore. Overall, the assumption chain may look like (Bytecode can only originate from Java/Kotlin => Bytecode is correct) => No need for checks.
Consider the implemention of a previous sample bytecode instruction: move vA, vB
%def op_move(is_object="0"):
    /* for move, move-object, long-to-int */
    /* op vA, vB */
    lsr     w1, wINST, #12              // x1<- B from 15:12
    ubfx    w0, wINST, #8, #4           // x0<- A from 11:8
    FETCH_ADVANCE_INST 1                // advance rPC, load wINST
    GET_VREG w2, w1                     // x2<- fp[B]
    GET_INST_OPCODE ip                  // ip<- opcode from wINST
    .if $is_object
    SET_VREG_OBJECT w2, w0              // fp[A]<- x2
    .else
    SET_VREG w2, w0                     // fp[A]<- x2
    .endif
    GOTO_OPCODE ip                      // execute next instruction
With a basic understanding of assembly, we cannot seem to spot any bounds checks on vreg indices… Surely they are located in macros like GET_VREG and SET_VREG(_OBJECT)!
.macro GET_VREG reg, vreg
    ldr     \reg, [xFP, \vreg, uxtw #2]
.endm
.macro GET_VREG_OBJECT reg, vreg
    ldr     \reg, [xREFS, \vreg, uxtw #2]
.endm
.macro SET_VREG reg, vreg
    str     \reg, [xFP, \vreg, uxtw #2]
    str     wzr, [xREFS, \vreg, uxtw #2]
.endm
.macro SET_VREG_OBJECT reg, vreg
    str     \reg, [xFP, \vreg, uxtw #2]
    str     \reg, [xREFS, \vreg, uxtw #2]
.endm
There are no checks! Looking back at the nterp stack frame allows estimating the impact: (almost) arbitrary stack index out - of - bounds access (i.e. read and write). Interestingly, all bytecode implementations I reviewed missed out on index bounds checks.
What is more is that, if we claimed that e.g. v0 contains an object and called move-object v42, v0, then nterp would happily copy it over. Notice that move_object calls op_move(is_object="1"). For a concrete example of how to interpret an arbitrary value as an object reference, consider the case where the method is allocated enough space to hold four vregs, i.e. v0 to v3 are valid. Knowing that r0 to r3 precede v0 in memory, this also implies that r4 = v0, i.e. r4 and v0 overlap. Hence, setting v0 makes v4 interpret the contents of v0 as an object. Another, similar approach can be seen below:
const-wide/32 v0, <fake object address>
move-object v0, v0
This works, because op_move v0, v0 moves the value in vreg v0 into both, v0 and r0. I.e. when calling move-object vA, vB, it does not matter whether vB actually contains an object. After the move, whatever was in vB (not rB) will be interpreted as an object in vA. This is kind of like a fakeobj primitive in browser exploitation, i.e. a type confusion.
In a nutshell, Android’s interpreter nterp blindly trusts that the bytecode to execute is correct and does not try to “harm” the execution environment. This is what makes bytecode injection a nice intermediate stage to eventually run a JITROP.
Fork Server Architecture on Android
A fork server architecture refers to a multi - process mechanism that creates new processes from a base process using the fork
syscall, often as a reaction to a certain event. Most importantly, whatever process invokes fork is duplicated, and control - flow for both, parent (old) and child (new) processes, continues right behind the fork syscall instruction. Usually, a C program calling fork looks like so:
pid_t pid = fork();
if (pid < 0) {
    // error
} else if (pid == 0) {
    // child process
} else {
    // parent process
}
Assuming the child process does not run execve or similar, child and parent share the same memory layout. This means e.g. that the base addresses of common libraries like libc.so.6 are identical in child and parent processes! Given a vulnerability in the parent process and that an attacker already controls the child process, information leaks are often not required anymore for successful exploitation. To take this even further, not just the layout is identical, but also majority of the contents.
While duplicating processes seems like a bad idea from a security perspective, especially when memory unsafe languages are involved, the fork server architecture can function as a form of optimization. Specifically, on mobile devices with significantly less computational power and memory than your average PC, operating systems can pre - initialize common parts of all apps in a particular base process. Then, when a user starts an app, the base process is forked and app - specific behaviour is loaded - no need to repeat the same initialization phase for each app.
Of course, Android does exactly that: uses a base process called zygote64 to set up, among other things, the JVM. Also, common shared libraries are loaded, garbage collection is set up, some common objects are created and much more. Although this increases app performance, especially during startup, it also implies that every app knows the majority of the memory layout of all other apps. Notice that the process used for forking, i.e. zygote64, is run by root. Therefore, all “normal” apps know a lot about the memory layout and contents of a root process!
Now, lets figure out what and how many memory regions are actually shared!
Maps Diffing
A very simple heuristic to figure out common memory regions over a set of running processes is to use the /proc/<pid>/maps file. Usually, on any operating system not using a fork server architecture, we would expect to have no matching memory regions in terms of name, virtual address, size and permissions. However, knowing that apps are forked from zygote64, we can simply take the intersection of the sets of memory regions of all processes in question to get an approximation for all duplicated memory regions.
To get this job done, we can reuse an existing maps parser . The most crucial code can be seen below:
MAPS_LINE_RE = re.compile(r"""
    (?P<addr_start>[0-9a-f]+)-(?P<addr_end>[0-9a-f]+)\s+  # Address
    (?P<perms>\S+)\s+                                     # Permissions
    (?P<offset>[0-9a-f]+)\s+                              # Map offset
    (?P<dev>\S+)\s+                                       # Device node
    (?P<inode>\d+)\s+                                     # Inode
    (?P<pathname>.*)\s+                                   # Pathname
""", re.VERBOSE)

@dataclass()
class Record:
    addr_start: int
    addr_end: int
    perms: str
    offset: int
    dev: str
    inode: int
    pathname: str
    ...

def parse(lines: List[str]) -> List[Record]:
    """Parses maps records from the list of all lines in a maps file.
    """
    return [
        Record(*m.groups())
        for line in lines
        if (m := MAPS_LINE_RE.match(line)) is not None
    ]

def diff_regions(lhs: List[Record], rhs: List[Record]) -> List[Record]:
    """Performs lhs = lhs <intersect> rhs in terms of set intersection.
    """
    return [
        lhs[lhs.index(r)]
        for r in rhs
        if r in lhs
    ]
Then, with a list of memory regions for each target app, taking the intersection gives the approximate set of duplicated memory regions. Of course, we could simply use zygote64 and any app to get the set of memory regions coming directly from the base process. For a sample comparison on the test device, consider the following output:
(host)$ python3 ./maps_differ.py <pid of zygote64> <pid of com.google.android.youtube>
...
[1754]: 0x78f19d7000 - 0x78f19d9000 (offset: 0x0): [anon:.bss] (rw-p)
[1755]: 0x7fdab74000 - 0x7fdab75000 (offset: 0x0):  (---p)
[1756]: 0x7fdab75000 - 0x7fdb374000 (offset: 0x0): [stack] (rw-p)
Total: 1757
Despite looking like a big number, without a reference we cannot make any observations on that number alone. So, consider the number of entries in the /proc/$(pidof zygote64)/maps:
(device)# wc -l /proc/$(pidof zygote64)/maps
1784 /proc/752/maps
This means that 1757 out of 1784 maps entries may have been duplicated during the fork, which is roughly 98.5%. Notice that the child process may have unmapped or remapped some regions of its parent. The above intersection is done on all attributes of the maps entries, meaning that remapping a memory region already causes our analysis to discard that region. However, in this case only memory regions that have not changed are relevant for exploitation! To stabilize this approach, one can repeatedly restart an app and compute the set of common memory regions over multiple app restarts.
Note: Doing this maps diffing over device reboots reveals two duplicated memory regions, namely
[anon:dalvik-main space (region space)] (rw-p)and[anon:dalvik-Sentinel fault page] (---p). However, rebooting the device should also re - randomize the layout ofzygote64! Therefore, these two memory regions must be deterministic! While the sentinel fault page does not have any permissions set (maybe look into segfault handlers for special logic for that region), the first region is readable and writable. Hence, even a remote attacker can predict the location of a readable and writable memory region without a concrete information leak other than the target OS version! However, notice that this region is garbage collected and where (Java) objects are stored, so writing without understanding the GC will probably cause various crashes and be very instable.
Observe that getting an idea of what memory regions are duplicated across all apps allows to make reasonable assumptions on memory region positions in a local attacker scenario. If an attacker controls an unprivileged app, then knowing that e.g. libart.so is duplicated will enable the attacker to make the assumption that his/her location of libart.so is identical to the location in a victim app. Also, the only reason I spotted the deterministic memory regions was because of maps diffing. I never expected to find deterministic memory regions on modern devices and thus did not bother searching.
Memory Regions
With a set of duplicated memory regions at hand, we can now proceed with analysing what is actually shared. To save some time, the following entries are of interest:
[0001]: 0x6f3be000 - 0x6f64c000 (offset: 0x0): [anon:dalvik-/system/framework/boot.art] (rw-p)
[0008]: 0x6fa71000 - 0x6fa72000 (offset: 0x0): [anon:.bss] (rw-p)
[0425]: 0x763343d000 - 0x7633dbd000 (offset: 0x1a18000): /system/framework/framework.jar (r--p)
[0431]: 0x7635e00000 - 0x7635f54000 (offset: 0x0): /apex/com.android.art/lib64/libart.so (r--p)
There are plenty of resources discussing common file types like .so and .jar. However, .art
is a bit trickier. Most importantly, .art files contain heap dumps of C++ objects. Because (Java) objects are based on C++ objects on Android, this means .art may also contain (Java) objects (which they do btw).
So, what about the [anon:.bss]? To this day, I have no clue what this is used for, but they proved to have the following important properties:
- Some
[anon:.bss]regions are in 32-bit memory. - Readable and writable permissions.
- At least
0x1000bytes in size.
The first property is very important for object references in e.g. Java, because these are restricted to 32-bit pointers.
Further, the framework.jar file seems to contain the entire ART Java code and probably the standard library part like Runtime. This is important, because if an attacker is able to redirect bytecode control - flow to a chosen location, framework.jar will be gadget heaven. Hence, we will take a quick look at the internals of framework.jar.
Framework JAR File Components
It turns out that the framework.jar is just a zip archive. Unzipping using unzip reveals the following, filtered contents:
(host)$ unzip framework.jar
(host)$ ls
android  classes.dex  classes2.dex  classes3.dex  classes4.dex  com  META-INF  res
Everything except for the .dex files is a directory, probably describing the structure of .jar file and what data is provided, i.e. metadata. The most interesting components are .dex files
, which contain the actual code provided by the .jar file, along with types, strings and more. .dex files are also part of .apk files, i.e. apps, and contain the application - specific and some framework code. Again, whatever .dex is the current context, we will be restricted to the resources provided by that .dex file, if the goal is to stay on bytecode - level.
To analyse .dex files a plethora of tools is available online. Mainly, we are interested in indices into certain tables like type and method tables. To that end, one can simply use dexlib2 or Topper
.
Although I developed Topper for a different, now obsolete reason, its core engine still allows extracting the information needed. Basically, what can be done is the following:
> file --file <path to .dex file> --type DEX
classes.dex> list methods --regex "UiAutomation::executeShellCommand"
[Offset = 0x0]: classes.dex
  [Index = 0x39fc, Offset = 0x25e0f0, Num Regs = 0x10]: private android/os/ParcelFileDescriptor[] android/app/UiAutomation::executeShellCommandInternal(java/lang/String command, boolean includeStderr)
  [Index = 0x39fb, Offset = 0x25e05c, Num Regs = 0x8]: public android/os/ParcelFileDescriptor android/app/UiAutomation::executeShellCommand(java/lang/String command)
  [Index = 0x39fd, Offset = 0x25e1f0, Num Regs = 0x3]: public android/os/ParcelFileDescriptor[] android/app/UiAutomation::executeShellCommandRw(java/lang/String command)
  [Index = 0x39fe, Offset = 0x25e20c, Num Regs = 0x3]: public android/os/ParcelFileDescriptor[] android/app/UiAutomation::executeShellCommandRwe(java/lang/String command)
  [Index = 0x39fb]: android/os/ParcelFileDescriptor android/app/UiAutomation::executeShellCommand(Ljava/lang/String;)
  [Index = 0x39fc]: android/os/ParcelFileDescriptor[] android/app/UiAutomation::executeShellCommandInternal(Ljava/lang/String;, Z)
  [Index = 0x39fd]: android/os/ParcelFileDescriptor[] android/app/UiAutomation::executeShellCommandRw(Ljava/lang/String;)
  [Index = 0x39fe]: android/os/ParcelFileDescriptor[] android/app/UiAutomation::executeShellCommandRwe(Ljava/lang/String;)
Notice that loading classes.dex from framework.jar may take some time, because Topper tries to “decompile” all methods into their smali representations, all on a single thread (it was a research project btw.)! However, observe that methods are prefixed with information about their index, offset and number of used virtual registers. Some information is taken from the so - called code_item
. Apparently, the .dex file contains duplicate definitions of methods, or, more likely, an abstract description and a concrete definition. When looking at methods, only consider the entries that have an offset and the number of registers set. With the above, it is apparent that framework.jar contains code that enables execution of shell commands.
Similar to method indices, type indices can be extracted like so:
classes.dex> list types --regex "android/app/UiAutomation"
[Offset = 0x0]: classes.dex
  [Index = 0x599]: android/app/UiAutomation$AccessibilityEventFilter
  [Index = 0x59a]: android/app/UiAutomation$ConnectionState
  [Index = 0x59b]: android/app/UiAutomation$IAccessibilityServiceClientImpl$1$$ExternalSyntheticLambda0
  [Index = 0x59c]: android/app/UiAutomation$IAccessibilityServiceClientImpl$1
  [Index = 0x59d]: android/app/UiAutomation$IAccessibilityServiceClientImpl
  [Index = 0x59e]: android/app/UiAutomation$OnAccessibilityEventListener
  [Index = 0x59f]: android/app/UiAutomation
  ...
So, one might ask why we use a tool to extract indices. In a practical setting, an attacker controlling an unprivileged app most likely does not have access to external tools like Topper. There are two perspectives to consider. First, these indices can be considered to be part of the manual component of an exploit, similar to what gadget offsets are in a simple, classical ROP chain. The other perspective is more similar to the idea of JITROP, where the app dynamically calculates the needed indices. Luckily, the latter is possible, because e.g. framework.jar is duplicated into every app process. If, however, an application - specific .dex file is required to make an exploit work, then only the first perpespective seems feasible, unless an attacker can get a hold of the target .apk file.
Alternative: dexdump
Another tool that may reveal the required information is dexdump
. It seems to be available on Android devices by default, i.e. it can be run via
(device)$ dexdump ./classes.dex | head
Processing './classes.dex'...
Opened './classes.dex', DEX version '039'
Class #0            -
  Class descriptor  : 'Landroid/Manifest$permission;'
  Access flags      : 0x0011 (PUBLIC FINAL)
  Superclass        : 'Ljava/lang/Object;'
  Interfaces        -
  Static fields     -
    #0              : (in Landroid/Manifest$permission;)
      name          : 'ACCEPT_HANDOVER'
...
Although no guarantees are made that dexdump provides the information required for exploitation, it may be easier to utilize than Topper!
Region Diffing
Instead of comparing the memory layout of two apps over multiple app restarts or even device reboots, we can also inspect how the actual data changes, in fancy terms: region diffing. Again, we use a naive heuristic that simply compares two instances of the same memory region, each coming from a different app process (potentially the same app, just restarted), byte by byte. Because many memory regions are large, comparing two or more memory regions is time consuming. Hence, this post only considers a special region: [anon:dalvik-/system/framework/boot.art] (rw-p).
There are several ways to hijack bytecode control - flow on Android. One way revolves around replacing an existing, valid object with a fake object. boot.art contains heap - dumps consisting of e.g. objects and turned out to be quite reliable as regards hijacking control - flow. It is important to note that these dumped objects come from somewhere that exists before the app does, so their layouts and locations are most likely predictable. With the deterministic dalvik-main space, an attacker could try to replace an object with a fake one, but the GC often moves objects within that region, so that does not seem like a consistent, stable approach. Thus, boot.art seems like the best bet for this task.
To perform region diffing, we can use Frida
. Similar to maps diffing, we start an app, pull its boot.art from memory and repeat. Before that, we can also ensure that boot.art is used at all. One way to do that is by simply changing the region’s permissions from rw- to ---, which should trigger a crash:
gef➤  vmmap boot.art
0x0000006fe57000 0x000000700e5000 0x00000000000000 rw- [anon:dalvik-/system/framework/boot.art]
gef➤  mprotect 0x0000006fe57000 0
gef➤  continue
Thread 15 "Profile Saver" received signal SIGSEGV, Segmentation fault.
Using a simple tool I wrote, we can obtain the following, interesting matching regions regarding boot.art:
$ python3 maps_differ.py
(Cmd) ...
(Cmd) search maps --regex ".*boot.art"
0x6fe57000 - 0x700e5000 (offset: 0x0): [anon:dalvik-/system/framework/boot.art] (rw-p)
...
(Cmd) diff region --count 4 --region-base 0x6fe57000 --names com.poc.poc_local
...
Found 4010 matching blob(s).
(Cmd) search blobs
0x6fe57000 - 0x6fe57e08 (size: 0xe08)
0x6fe57e09 - 0x6fe59bbc (size: 0x1db3)
0x6fe5700d - 0x6fe57012 (size: 0x5)
0x6fe57024 - 0x6fe57028 (size: 0x4)
0x6fe57034 - 0x6fe5703a (size: 0x6)
...
0x6fff9250 - 0x7003c656 (size: 0x43406)
From the above results, we can see that the first 0xe08 bytes of the region remain constant over multiple runs. Furthermore, a single byte at address <boot.art> + 0xe08 seems to change over multiple runs. After the single byte, another 0x1db3 bytes are constant. Also, towards the end of boot.art seems to be a very large constant region. Therefore, and because of the fact that boot.art contains dumped objects, boot.art is a suitable candidate for semantic analysis. Note that up to this point, we only checked whether resources change over app restarts via byte - by - byte comparison. Btw. some changing resources are also interesting. For example, an object located in boot.art may change, because the GC moved a referenced object to another location.
Monitoring Memory Accesses to boot.art
The goal is to figure out what resources in boot.art are accessed by an app. Knowing that Android apps adhere to the application lifecycle
, we are especially interested in resources that are accessed during inevitable events like onStop and onDestroy!
Again, Frida helps monitoring memory accesses in the following way:
def region_to_js(region):
    return json.dumps({
        'addr_start': region.addr_start,
        'addr_end': region.addr_end
    })

def regions_to_js_array(regions):
    ar = '['
    for i, region in enumerate(regions):
        ar += region_to_js(region)
        if i < len(regions) - 1:
            ar += ','
    return ar + ']
...
script = session.create_script(f'''
    const regions = {regions_to_js_array(regions)};
    console.log(JSON.stringify(regions, null, 2));

    for (let region of regions) {{
        const frida_region = {{base: ptr(region.addr_start), size: region.addr_end - region.addr_start}};
        MemoryAccessMonitor.enable(frida_region, {{
            onAccess: function(details) {{
                console.log('Accessed ' + details['address'] + ' from: ' + details['from'].toString(16));
            }}
        }});
    }}
''')
What the above snippet does is monitor memory accesses to all regions specified in the regions list. From previous analyses, it is known that only one region is of interest, namely boot.art. With the above script and some user interaction to trigger onStop and onDestroy manually, it is possible to identify objects that are only accessed during these late lifecycle events. In my case, I found boot.art + 0x215f0, which turned out to be GRANDFATHERED
. One approach to figure out the identity of an object in memory is to set an object’s klass_ pointer to null and observe the stack trace in the crash dump via logcat. GRANDFATHERED is defined in LanguageTag like so:
class LanguageTag {
    ...
    private static final Map<String, String[]> GRANDFATHERED = new HashMap<>();
    ...
    public static LanguageTag parse(String languageTag, ParseStatus sts) {
        ...
        String[] gfmap = GRANDFATHERED.get(LocaleUtils.toLowerString(languageTag));
        ...
    }
}
Apparently, LanguageTag.parse is invoked somewhere inside a lifecycle method, most likely onStop, because the app does not need to be terminated to trigger this method invocation. To generalize this approach, if we are able to trigger an observable event when the object of interest is used, then we can emit behaviour that specifically triggers execution of lifecycle methods. For example, onDestroy is expected to only be called on app termination. Thus, if the object is used when the app is moved to the back, then it may be that the object is used in onStop. Of course, we would have to come up with a sophisticated set of experiments to precisely determine the lifecycle method that uses an object of interest!
Unfortunately, this story must be put on hold until the post on bytecode reuse attacks, as we only want to cover the basics in this post ;)
Summary
In this blog post, we peeked into various Android fundamentals, always driven by the goal of bytecode - based exploitation. First, bytecode basics are discussed, which lay a foundation for a follow - up discussion on weird behaviour inside bytecode. Then, a more practical view on Android’s fork server architecture is given. All major memory analysis steps used throughout this blog series are discussed.
Next up is the first bytecode - based exploitation technique: bytecode injection!