Exploits built around heap-based memory corruptions will never be perfectly reliable. There are multiple factors contributing to this, one being that the heap is shared among all tasks (user processes and kernel threads) running on a machine. Thus, the task running the exploit cannot exercise perfect control over it.
Much has already been written about the art of shaping the kernel heap and creating desired layouts reliably. This post assumes a reader who is somewhat familiar with the subject, i.e., I will not recount any basics here. Instead, I will focus on two generic techniques for improving an exploit process’ control over the kernel heap.
Motivating Example
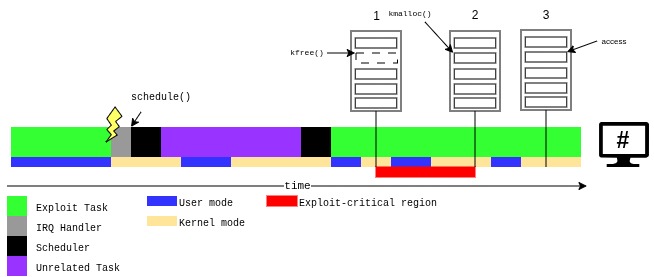
To get started, let’s look at the timeline of a prototypical, heap-based kernel exploit. (In the example we will use a UAF vulnerability, but the same reasoning applies to OOB writes and DFs.)
 |
|---|
| Timeline of a successful kernel heap exploit. |
Here:
- The exploit task makes a syscall that results in the freeing of the vulnerable object.
- Another syscall is performed to cause the allocation of another object in the slot previously occupied by the vulnerable object.
- During a third syscall, a dangling pointer to the vulnerable object is used and the resulting type-confusion is exploited.
So far, so good – but there is a time window between events 1 and 2 where the slot of the vulnerable object is vacant. I will call this time interval an “exploit-critical region” (ECR). We can informally define an ECR as a time span in which any heap operation that is not controlled or observable by the exploit task has the potential of causing the exploit to fail. A single exploit may have multiple ECRs.
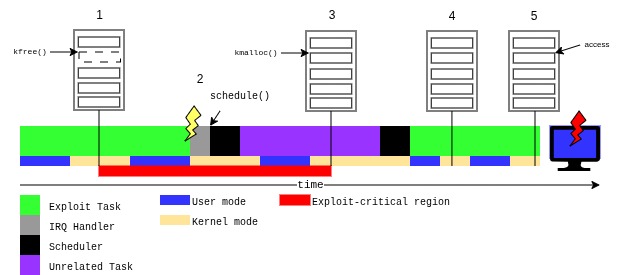
To get a feeling for how an uncontrolled heap operation during an ECR may cause exploit failure we can have a look at the following, alternative timeline.
 |
|---|
| Timeline of a failed kernel heap exploit. |
Here:
- The exploit task makes a syscall that results in the freeing of the vulnerable object.
- An interrupt occurs, and on exit from the interrupt handler, the scheduler is invoked. It decides to withdraw the CPU from the exploit task.
- Some unrelated task is scheduled. It performs a syscall that causes a heap allocation that reuses the vacant slot of the vulnerable object.
- When the exploit task gets the CPU back, it tries to allocate the fake object in the slot previously occupied by the vulnerable object, however, this endeavor is doomed to failure.
- The UAF is triggered but operates on the wrong object – a good recipe for blinking shift keys.
In general, the reliability of heap exploitation is degraded by the following factors:
- unknown initial heap state,
- randomization-based exploit mitigations,
- other actors using the same heap (above example),
- task migration,
- delayed work mechanisms.
I’ll now present two techniques aimed at addressing the third factor. It is assumed that exploitation can reliably take place on a single CPU via pinning. However, it may be possible to adapt the first technique to scenarios where pinning is blocked.
Technique I: FreshSlices
Task scheduling in the Linux kernel is a somewhat complex topic and our discussion is going to remain on a qualitative level. In general, the scheduler’s job is to multiplex the CPU among all runnable tasks. For our purposes, it suffices to know that the scheduler assigns a fraction of the CPU to each task and tries to ensure that in any given interval $\Delta t$ every runnable task has run for the time $c\Delta t$, where $c$ is the fraction of the CPU granted to the task. In reality, of course, $\Delta t$ is not arbitrarily small but somewhere on the order of milliseconds.
From this high-level design, it follows that a task which has already been executing for some time has consumed a larger share of its allotted CPU budget relative to its competitors. The key observation here is that the instantaneous risk of a task losing the CPU to another task increases the longer it has been running.
This implies that we want our ECR to be as close as possible to the start of our run on the CPU that the scheduler has granted us. Thus, we need a way to determine when “we just got the CPU back after a break on the bench”.
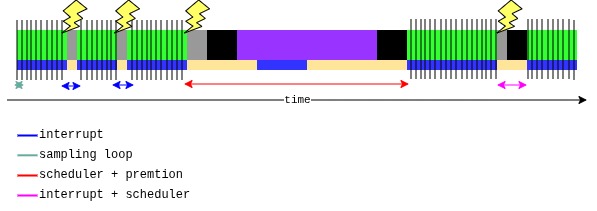
To do this we can sample the time stamp counter (TSC) register in a tight loop. As the timescale on which we can sample the TSC is small compared to the other relevant timescales (IRQ handlers, IRQ handler followed by a no-op context switch, or preemption by another task) we can reliably use it to determine the duration of our task’s runs on the CPU, the time we spent on the runqueue waiting for the CPU, and the moment we get the CPU back. We can furthermore tell if we got the CPU back after a preemption, an interrupt, or an interrupt followed by a no-op context switch as those timescales are (most of the time) sufficiently different.
 |
|---|
| TSC-sampling method for tracing scheduler operation. |
Let’s use this method to detect when the scheduler re-evaluates our presence on the CPU, i.e., when our task is involved in a sched_switch. In particular, we are not interested in interrupts that do not enter the scheduler as those are irrelevant from an exploitation point of view.
Concretely, the measurement logic of our program looks like this:
uint64_t start = rdtsc();
uint64_t prev = start;

i = 0;
while (i < N_TIMESLICES) {
    uint64_t cur = rdtsc();

    if (unlikely(cur - prev > SCHED_RUN_CYCLES)) {
        timeslices[i] = prev - start;
        off_times[i] = cur - prev;
        start = cur;
        i++;
    } else {
        loop_total += cur - prev;
    }
    prev = cur;
    loops += 1;
}
An implementation of the FreshSlices technique.
Where:
SCHED_RUN_CYCLES(approx. 18us, found empirically) is a timescale (in cycles aka. TSC quanta) that is meant to separate IRQ handlers with and without asched_switchloop_totalapproximates the total number of cycles spent executing the measurement loopN_TIMESLICESis the number ofsched_switchevents we want to detecttimeslices[]is an array of cycles between distinctsched_switchevents where we werenextand thenprevoff_times[]is an array of cycles between distinctsched_switchevents where we wereprevand thennext, or the duration of a single no-op switch
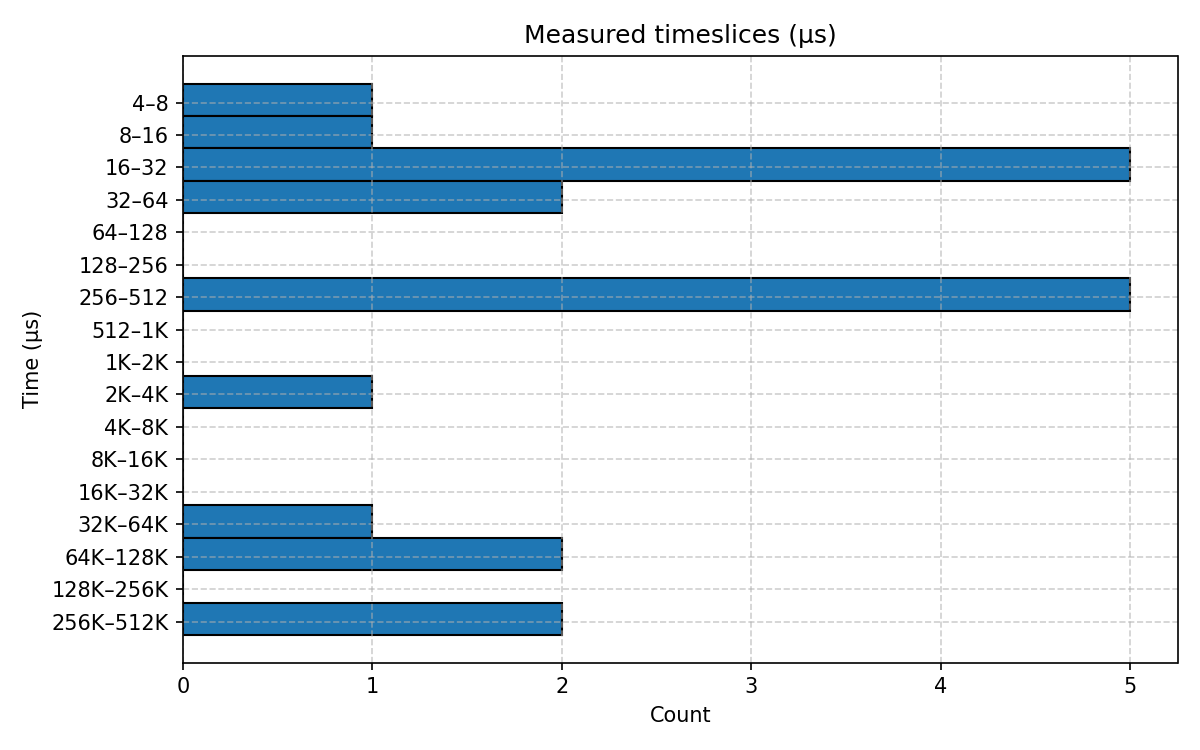
Running this program and plotting a histogram of the measured timeslices array gives us the following result.
 |
|---|
| Histogram of timeslices of the test program measured by the test program itself. |
We can validate that our measurement is correct by writing a small bpftrace script that attaches to the sched_switch tracepoint and collects the information we would expect to see in the timeslices array.
BEGIN
{
	printf("Tracing CPU scheduler... Hit Ctrl-C to end.\n");
	@target_comm = str($1);
}

tracepoint:sched:sched_switch
{
	if (args.next_comm == @target_comm &&
	    args.prev_comm == @target_comm &&
	    @start != 0) {
          @usecs = hist((nsecs - @start) / 1000);
	  @start = nsecs;
	} else if (args.next_comm == @target_comm) {
	  @start = nsecs;
	} else if (args.prev_comm == @target_comm && @start != 0) {
          @usecs = hist((nsecs - @start) / 1000);
	  @start = 0;
	}
}
bpftrace script to measure timeslices of a task.
Running this script while performing the experiment can be used to confirm the measurement results.
@usecs:
[16, 32)               3 |@@@@@@@@@@@@@@@@@@@@@@@@@@                          |
[32, 64)               6 |@@@@@@@@@@@@@@@@@@@@@@@@@@@@@@@@@@@@@@@@@@@@@@@@@@@@|
[64, 128)              0 |                                                    |
[128, 256)             0 |                                                    |
[256, 512)             5 |@@@@@@@@@@@@@@@@@@@@@@@@@@@@@@@@@@@@@@@@@@@         |
[512, 1K)              0 |                                                    |
[1K, 2K)               0 |                                                    |
[2K, 4K)               0 |                                                    |
[4K, 8K)               0 |                                                    |
[8K, 16K)              0 |                                                    |
[16K, 32K)             1 |@@@@@@@@                                            |
[32K, 64K)             1 |@@@@@@@@                                            |
[64K, 128K)            2 |@@@@@@@@@@@@@@@@@                                   |
[128K, 256K)           2 |@@@@@@@@@@@@@@@@@                                   |
Histogram of timeslices of the test program measured by the bpf program.
The above experiments were performed on a relatively calm desktop system. Repeating them on the same system while building a Linux kernel on all cores results in the following results.
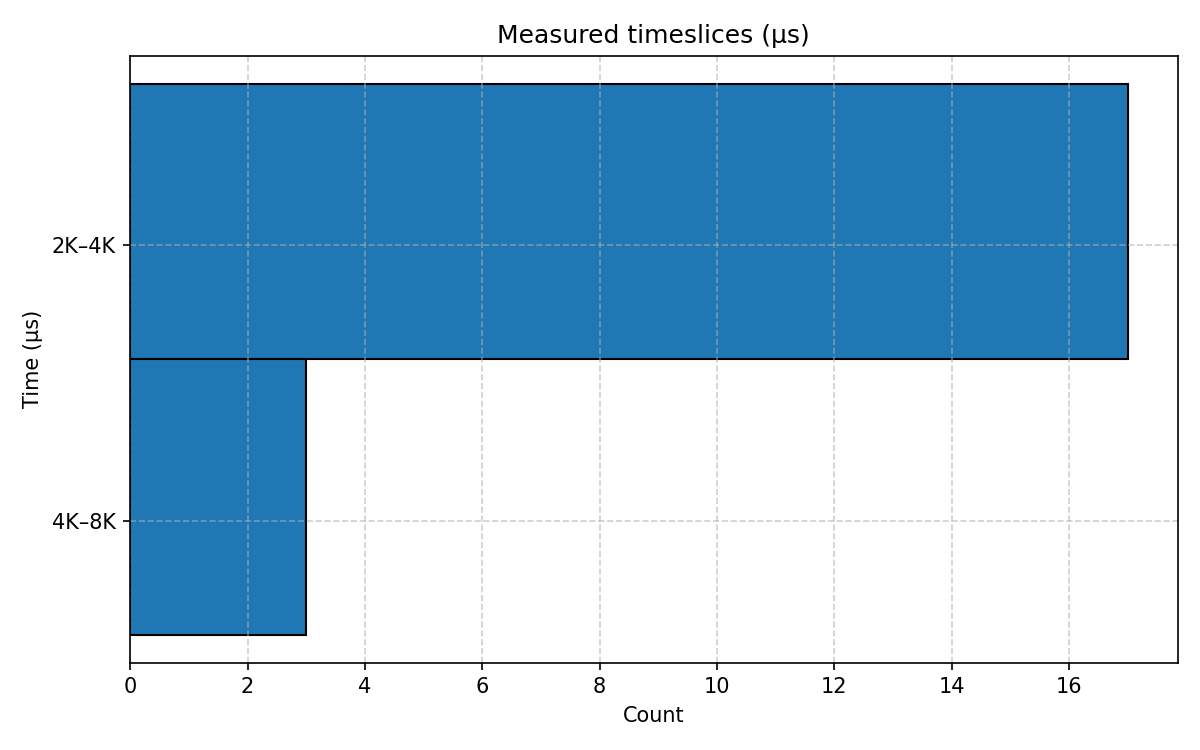 |
|---|
| Histogram of timeslices of the test program measured by the test program itself (while building the Linux kernel). |
@usecs:
[2K, 4K)              15 |@@@@@@@@@@@@@@@@@@@@@@@@@@@@@@@@@@@@@@@@@@@@@@@@@@@@|
[4K, 8K)               2 |@@@@@@                                              |
[8K, 16K)              1 |@@@                                                 |
Histogram of timeslices of the test program measured by the bpf program (while building the Linux kernel).
All in all, the TSC-sampling method described in this section allows an exploit program to trace the scheduler operation on its CPU, thus enabling more informed decisions regarding commitment to the execution of ECRs.
Note: Exploits sometimes do a sched_yield() before starting an ECR. This is giving the scheduler an early chance to select a more eligible task to run, i.e., if it returns we know that the scheduler has just decided that we are the most eligible task. However, it is neither telling us how eligible we were, nor is it changing any scheduling-related parameters of our process. The advantage of the above technique is that it gives us more information (duration of previous runs on the CPU, time spent off CPU) that we can use to decide whether we want to “take” our current run to perform the ECR. (An added bonus is that this method cannot be blocked via seccomp profiles).
Technique II: CPU-Bullying
FreshSlices aims to address unreliability factor number three by committing to ECRs only when we determine that there is a low risk of our task being preempted by another. However, it doesn’t guarantee that we are not preempted; thus, wouldn’t it be nice if we could also reduce the probability that a preempting task is using the heap? CPU-Bullying is a technique to achieve just that.
The scheduler aims to distribute load evenly across CPUs – a process called load balancing (ref and ref ). Most of the tasks on a system are not bound to a specific CPU, and are thus free to be moved around by the scheduler’s load balancing code.
The idea behind CPU-Bullying is simple: spawn a number of CPU-bound tasks on the same core as the exploit task to force the migration of unrelated tasks to other CPUs. As the execution of those tasks does not cause any kernel heap usage, being preempted by them is irrelevant from an exploit perspective.
A small bpftrace script can be used to observe task migrations.
BEGIN
{
    printf("Tracing CPU migration from/to CPU0... Hit Ctrl-C to end.\n");
}

tracepoint:sched:sched_migrate_task
{
    if (args.orig_cpu == 0 && args.dest_cpu != 0) {
        printf("--->> %d\t'%s'\n", args.pid, args.comm);
    } else if (args.dest_cpu == 0 && args.orig_cpu != 0) {
        printf("<<--- %d\t'%s'\n", args.pid, args.comm);
    }
}
bpftrace script to trace migration from/to CPU0.
Under normal operation, there is a constant stream of migration from and to a CPU.
# ./trace_task_migration_cpu0.bt
Attached 2 probes
Tracing CPU migration from/to CPU0... Hit Ctrl-C to end.
<<--- 5278	'threaded-ml'
<<--- 3035	'pipewire-pulse'
--->> 5278	'threaded-ml'
<<--- 2804	'Xorg'
--->> 3035	'pipewire-pulse'
--->> 2804	'Xorg'
<<--- 4922	'threaded-ml'
--->> 18377	'kworker/u48:11'
--->> 4922	'threaded-ml'
<<--- 2804	'Xorg'
<<--- 18431	'alacritty'
...
Load balancing task migration from and to CPU0.
Another interesting observable is the set of tasks that are scheduled on a given CPU in a fixed time interval. This requires a (slightly) longer bpftrace script, but in the end we can confirm that our CPU0 idles ~95% of the time.
# ./tasks_cpu0.bt
...
pid 05269	comm AudioOutputDevi	total rt 529 us
pid 00018	comm ksoftirqd/0    	total rt 13 us
pid 04922	comm threaded-ml    	total rt 3006 us
pid 02464	comm opensnitchd    	total rt 535 us
pid 05278	comm threaded-ml    	total rt 4440 us
pid 02832	comm brave          	total rt 510 us
pid 18911	comm StreamT~ns #912	total rt 342 us
pid 18715	comm kworker/0:1    	total rt 124 us
pid 05274	comm threaded-ml    	total rt 267 us
pid 04734	comm event_engine   	total rt 1491 us
pid 05501	comm chromium       	total rt 334 us
pid 02825	comm pavucontrol    	total rt 3419 us
pid 03968	comm Chrome_ChildIOT	total rt 143 us
pid 00000	comm swapper/0      	total rt 947829 us
pid 05280	comm ThreadPoolSingl	total rt 1998 us
pid 05268	comm AudioProcessing	total rt 13883 us
pid 03035	comm pipewire-pulse 	total rt 1467 us
pid 03995	comm WebRTC_W_and_N 	total rt 348 us
...
Tasks running on CPU0 during a period of 1s.
Spawning a large number of CPU-bound tasks on the same CPU as the one running the exploit task leads to a distinct exodus of unrelated tasks.
<<--- 19133	'cpu_bully'
--->> 19125	'bpftrace'
--->> 3895	'brave'
--->> 2804	'Xorg'
--->> 5033	'Compositor'
--->> 5027	'brave'
--->> 6367	'SharedWorker th'
--->> 4728	'event_engine'
--->> 10069	'G1 Service'
--->> 3994	'WebRTC_Signalin'
--->> 2457	'thermald'
--->> 5516	'chromium'
--->> 13434	'HangWatcher'
--->> 5757	'HangWatcher'
--->> 5500	'CacheThread_Blo'
--->> 17926	'HangWatcher'
--->> 3899	'HangWatcher'
--->> 3981	'HangWatcher'
--->> 18756	'kworker/u48:7'
--->> 18518	'kworker/u48:13'
--->> 19000	'ServiceWorker t'
--->> 5713	'Chrome_ChildIOT'
Migration of unrelated tasks away from CPU0 when performing CPU-Bullying.
The cpu_bully program pins itself to CPU0, spawns ten CPU-bound threads (also pinned to CPU0), and then busy-waits for a while to give the load balancer a chance to migrate all movable tasks to other CPUs. We can clearly see this happening using our first script.
It then goes on to simulate an ECR by changing its comm to ecr (and later to no_ecr to mark the end of the simulated ECR). Using the second script, we can confirm that only a minimal number of unrelated tasks (only those also pinned to CPU0) are scheduled during the ECR.
----
pid 19212	comm cpu_bully/5    	total rt 93314 us
pid 19207	comm cpu_bully/0    	total rt 89998 us
pid 19060	comm kworker/0:2    	total rt 14 us
pid 19214	comm cpu_bully/7    	total rt 89994 us
pid 19216	comm cpu_bully/9    	total rt 89990 us
pid 19209	comm cpu_bully/2    	total rt 89992 us
pid 19211	comm cpu_bully/4    	total rt 93319 us
pid 19208	comm cpu_bully/1    	total rt 89990 us
pid 19206	comm cpu_bully      	total rt 89982 us
pid 19210	comm cpu_bully/3    	total rt 89985 us
pid 19215	comm cpu_bully/8    	total rt 89997 us
pid 19213	comm cpu_bully/6    	total rt 89995 us
----
pid 19212	comm cpu_bully/5    	total rt 76916 us
pid 19207	comm cpu_bully/0    	total rt 78819 us
pid 19060	comm kworker/0:2    	total rt 24 us
pid 00762	comm irq/174-iwlwifi	total rt 17 us
pid 19214	comm cpu_bully/7    	total rt 76027 us
pid 19216	comm cpu_bully/9    	total rt 79462 us
pid 19209	comm cpu_bully/2    	total rt 77559 us
pid 19211	comm cpu_bully/4    	total rt 76149 us
pid 00107	comm irq/9-acpi     	total rt 1147 us
pid 19208	comm cpu_bully/1    	total rt 79143 us
pid 19206	comm ecr             	total rt 92847 us
pid 19210	comm cpu_bully/3    	total rt 78881 us
pid 19215	comm cpu_bully/8    	total rt 79910 us
pid 19213	comm cpu_bully/6    	total rt 78741 us
----
pid 19212	comm cpu_bully/5    	total rt 75100 us
pid 19207	comm cpu_bully/0    	total rt 75160 us
pid 19060	comm kworker/0:2    	total rt 9 us
pid 19214	comm cpu_bully/7    	total rt 74969 us
pid 19216	comm cpu_bully/9    	total rt 76472 us
pid 19209	comm cpu_bully/2    	total rt 75875 us
pid 19211	comm cpu_bully/4    	total rt 75261 us
pid 19208	comm cpu_bully/1    	total rt 74867 us
pid 19206	comm no_ecr          	total rt 92950 us
pid 19210	comm cpu_bully/3    	total rt 76807 us
pid 19215	comm cpu_bully/8    	total rt 76178 us
pid 19213	comm cpu_bully/6    	total rt 76647 us
pid 00023	comm migration/0    	total rt 2 us
Tasks scheduled on CPU0 in three consecutive seconds during a simulated ECR with CPU-Bullying.
Repeating the above experiments on a loaded system (compiling Linux on all cores) yields the same results.
In general, CPU-Bullying seems to be a promising technique to practically eliminate the threat that unexpected heap usage poses to exploit reliability. I also consider it to be strictly more powerful than FreshSlices. However, FreshSlices may still be useful in situations where sandboxes limit an exploit’s resource consumption or block the sched_setaffinity syscall.
Project Ideas
It seems like those ideas could be a nice starting point for a student project - because they are exactly that: ideas. While they might sound reasonable and my ad-hoc experiments seem to back this belief, they lack a proper evaluation. There is even a closely-related paper that could serve as a blueprint for such a work.
Code
The code mentioned in this post can be found here .
